大家好,又见面了,我是你们的朋友全栈君。如果您正在找激活码,请点击查看最新教程,关注关注公众号 “全栈程序员社区” 获取激活教程,可能之前旧版本教程已经失效.最新Idea2022.1教程亲测有效,一键激活。
Jetbrains全系列IDE稳定放心使用
qcustomplot使用记录
-
问题描述:在做统计图时需要在一个坐标系中绘制不同颜色的柱状条。使用Qt中的qtchart可以进行绘制柱状图,使用qtchart绘制柱状图时的问题:绘制的柱状图只能时分组的那种柱状图,横坐标只能时字符串类型(若是将字符串中写为数字可解决此问题);因为横坐标只能为字符串类型,因此在横坐标具体的某值上绘制不可控,坐标数据过多还会出现显示不全等问题;柱状图颜色只能设置为统一的。很难满足需求,因此选用第三方库qcustomplot。可从官网下载库添加到自己的程序中使用即可。
-
此第三方库绘制柱状图、折线图可以,绘制三维图、曲线图、散点图、饼图目前先使用qtchart。
-
QCustomPlot offers many other plottable classes:
QCPGrar QCPCurve QCPBars QCPStatisticalBox QCPColorMap QCPFinancial QCPErrorBars
绘制柱状图
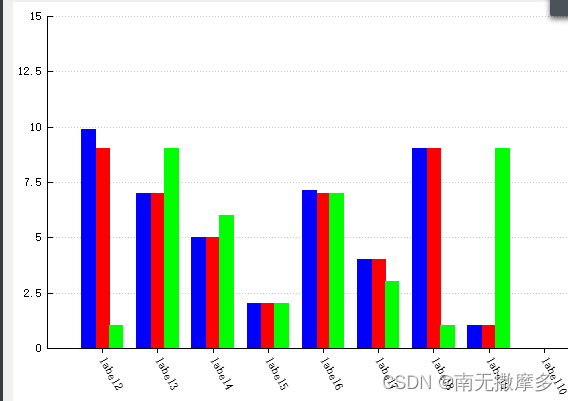
void myCustomPlot::initMyCustomPlot2()
{
    //绘制绘图对象
    minBar = new QCPBars(ui->customPlot->xAxis,ui->customPlot->yAxis);
    maxBar = new QCPBars(ui->customPlot->xAxis,ui->customPlot->yAxis);
    fossil = new QCPBars(ui->customPlot->xAxis,ui->customPlot->yAxis);

    //设置画笔的颜色
    minBar->setPen(QPen(Qt::red));
    maxBar->setPen(QPen(Qt::green));
    fossil->setPen(QPen(Qt::blue));

    minBar->setBrush(Qt::red);
    maxBar->setBrush(Qt::green);
    fossil->setBrush(Qt::blue);

    QCPBarsGroup *group = new QCPBarsGroup(ui->customPlot);
    group->setSpacingType(QCPBarsGroup::stAbsolute);//设置组内柱状图的间距,按像素
    group->setSpacing(0);//设置较小的间距值,这样看起来更紧凑


    fossil->setBarsGroup(group);
    minBar->setBarsGroup(group);
    maxBar->setBarsGroup(group);

    //设置大小
   // minBar->setBaseValue(0.5);//设置柱状图距x轴的距离
    //设置柱状图的宽度
    minBar->setWidth(0.5);
    maxBar->setWidth(0.5);
    fossil->setWidth(0.5);

    //设置抗锯齿
    minBar->setAntialiased(false);//give more crips,pixel aligned bar borders
    maxBar->setAntialiased(false);
    fossil->setAntialiased(false);


    //添加数据
    //设置坐标
    QVector<double> ticks;
    QVector<QString> labels;

    //添加元素,将拉大刻度间的间距
    int count = 2;
    for(int i=0;i<20;i++){
        if(i == count){
            ticks<<i;
            count += 2;
        }
    }

    count = 0;
    for(int i=0;i<30;i++){
        if(i == 2+count){
            //labels << QString::number(i,10);
            labels << QString::asprintf("label%1").arg(i);
            count += 1;
        }
    }

    //共享指针,坐标轴设置
    QSharedPointer<QCPAxisTickerText> textTicker(new QCPAxisTickerText);
    textTicker->addTicks(ticks,labels);

   // ui->customPlot->plotLayout()->insertRow(0);//加上这行,图表显示出来的比较小,why?
    //添加x轴
    ui->customPlot->xAxis->setTicker(textTicker);
    //设置标签的旋转
    ui->customPlot->xAxis->setTickLabelRotation(60);
    ui->customPlot->xAxis->setSubTicks(false);
    //设置刻度线的长度
    ui->customPlot->xAxis->setTickLength(0,4);
    //设置x轴的范围
    ui->customPlot->xAxis->setRange(0,20);

    //分层设置
    ui->customPlot->xAxis->grid()->setVisible(false);
    ui->customPlot->yAxis->grid()->setSubGridVisible(false);
    ui->customPlot->yAxis->setSubTicks(false);

    //设置y轴的范围
    ui->customPlot->yAxis->setRange(0,15);

    QVector<double> y,y1,y2;
    y<< 9 <<7 <<5 <<2 <<7 <<4 <<9 <<1;
    y1<< 1 <<9.03 <<6 <<2 <<7 <<3 <<1 <<9;
    y2<< 9.87 <<7 <<5 <<2  <<7.12  <<4  <<9 <<1 ;

    minBar->addData(ticks,y);
    maxBar->addData(ticks,y1);
    fossil->addData(ticks,y2);

    //刷新数据
    ui->customPlot->replot();
}

//创建一个柱状图,并且设置它的风格
    QCPAxis *keyAxis = ui->customPlot->xAxis;
    QCPAxis *valueAxis = ui->customPlot->yAxis;
    QCPBars *fossil = new QCPBars(keyAxis,valueAxis);

    fossil->setAntialiased(false);//为了更好的边框效果,关闭抗锯齿
    fossil->setName("Fossil fuels");//设置柱状图的名字,可在图例中显示
    fossil->setPen(QPen(QColor(0,168,140).lighter(130)));//设置柱状图的边框颜色
    fossil->setBrush(QColor(0,168,140));//设置柱状图的画刷颜色

    //为柱状图设置一个文字类型的key轴,ticks决定了轴的范围,而labels决定了轴的刻度文字显示
    QVector<double> ticks;
    QVector<QString> labels;
    ticks<<1 <<2 <<3 <<4 <<5 <<6 <<7;
    labels<< "USA" << "Japan" <<"Germany" <<"France" <<"UK"<<"Italia"<<"Canada";
    QSharedPointer<QCPAxisTickerText> textTicker(new QCPAxisTickerText);
    textTicker->addTicks(ticks,labels);

    keyAxis->setTicker(textTicker);

    //设置轴的范围,并为其添加数据
    keyAxis->setTickLabelRotation(60);//轴刻度文字旋转60度
    keyAxis->setSubTicks(false);
    keyAxis->setTickLength(0,4);
    keyAxis->setRange(0,8);
    keyAxis->setUpperEnding(QCPLineEnding::esSpikeArrow);

    valueAxis->setRange(0,12.1);
    valueAxis->setPadding(35);//轴的内边距
    valueAxis->setLabel("power consumption");
    valueAxis->setUpperEnding(QCPLineEnding::esSpikeArrow);
    QVector<double> fossilData;

    fossilData << 0.86*10.5 <<0.83*5.5 <<0.84*5.5 <<0.52*5.8 <<0.89*5.2 <<0.90*4.2 <<0.67*11.2;

    fossil->setData(ticks,fossilData);
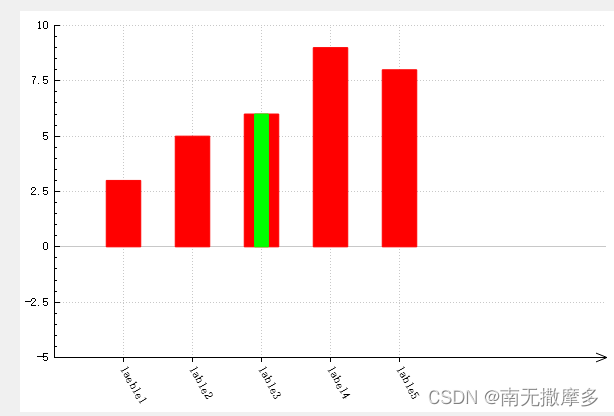
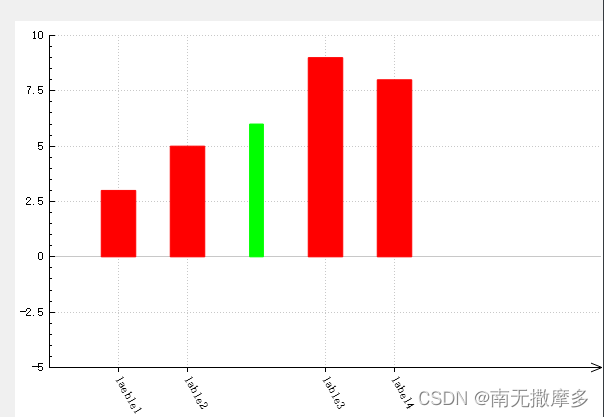
//绘制柱状图,实现不同柱状条可以是不同的颜色
/*
思路:一个柱状图的颜色是不能改变的,那就多少种颜色绘制多少个柱状图,不同颜色的数据分开,只要刻度设置没问题,就可以实现。多个柱状图共用同一个坐标系。即:坐标系只设置一次,柱状图可以绘制多个
*/
//绘制柱状图
QCPAxis *keyAxis = ui->customPlot->xAxis;
QCPAxis *valueAxis = ui->customPlot->yAxis;
QCPBars *bars0 = new QCPBars(keyAxis,valueAxis);
QCPBars *bars1 = new QCPBars(keyAxis,valueAxis);
bars0->setPen(QColor(255,0,0));
bars0->setBrush(QColor(255,0,0));
bars0->setWidth(0.5);
bars0->setName("myBars0");
bars1->setPen(QColor(0,255,0));
bars1->setBrush(QColor(0,255,0));
bars1->setWidth(0.2);
bars1->setName("myBars1");
QVector<double> ticks,ticks1;
QVector<QString> lables,lables1;
QSharedPointer<QCPAxisTickerText> tickerText(new QCPAxisTickerText());
QVector<double> datay0,datay1;
ticks<< 1<< 2 <<3 <<4 <<5;
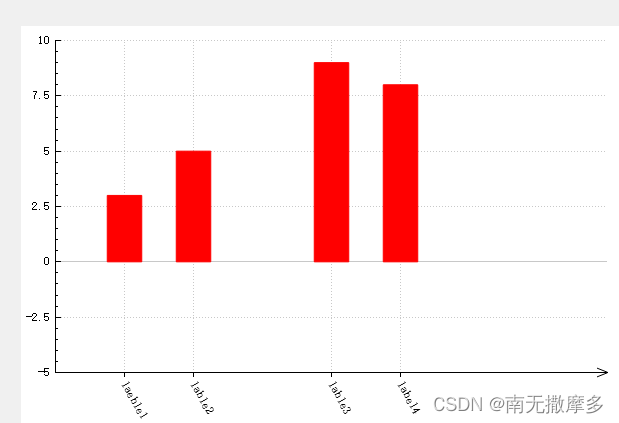
//ticks<< 1<< 2 <<4 <<5;
ticks1<<3;
lables<<"laeble1" <<"lable2" <<"lable3" <<"label4" <<"lable5";
tickerText->addTicks(ticks,lables);
datay0<< 3<< 5 << 6 <<9 <<8;
//datay0<< 3<< 5 <<9 <<8;
datay1<<6;
keyAxis->setTicker(tickerText);
keyAxis->setTickLabelRotation(60);
keyAxis->setTickLength(0,4);
keyAxis->setRange(0,8);
keyAxis->setUpperEnding(QCPLineEnding::esLineArrow);
ui->customPlot->yAxis->setRange(-5,10);
bars0->setData(ticks,datay0);
bars1->setData(ticks1,datay1);
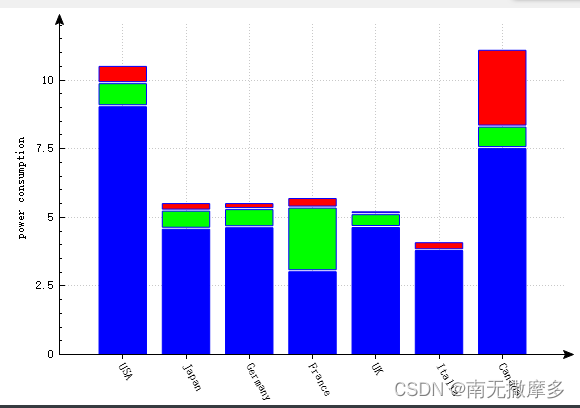
//堆积柱状图
void myCustomPlot::initMyCustomPlot5()
{//堆积柱状图
    QCPAxis *keyAxis = ui->customPlot->xAxis;
    QCPAxis *valueAxis = ui->customPlot->yAxis;
//    QCPBars *fossil = new QCPBars(keyAxis,valueAxis);

//    fossil->setAntialiased(false);//为了更好的边框效果,关闭抗锯齿
//    fossil->setName("Fossil fuels");//设置柱状图的名字,可在图例中显示
//    fossil->setPen(QPen(QColor(0,168,140).lighter(130)));//设置柱状图的边框颜色
//    fossil->setBrush(QColor(0,168,140));//设置柱状图的画刷颜色

    //为柱状图设置一个文字类型的key轴,ticks决定了轴的范围,而labels决定了轴的刻度文字显示
    QVector<double> ticks;
    QVector<QString> labels;
    ticks<<1 <<2 <<3 <<4 <<5 <<6 <<7;
    labels<< "USA" << "Japan" <<"Germany" <<"France" <<"UK"<<"Italia"<<"Canada";
    QSharedPointer<QCPAxisTickerText> textTicker(new QCPAxisTickerText);
    textTicker->addTicks(ticks,labels);

    keyAxis->setTicker(textTicker);

    //设置轴的范围,并为其添加数据
    keyAxis->setTickLabelRotation(60);//轴刻度文字旋转60度
    keyAxis->setSubTicks(false);
    keyAxis->setTickLength(0,4);
    keyAxis->setRange(0,8);
    keyAxis->setUpperEnding(QCPLineEnding::esSpikeArrow);

    valueAxis->setRange(0,12.1);
    valueAxis->setPadding(35);//轴的内边距
    valueAxis->setLabel("power consumption");
    valueAxis->setUpperEnding(QCPLineEnding::esSpikeArrow);


    //为了展示堆积柱状图,再添加两个柱状图
    QCPBars *regen = new QCPBars(keyAxis,valueAxis);
    QCPBars *nuclear = new QCPBars(keyAxis,valueAxis);
    QCPBars *fossil = new QCPBars(keyAxis,valueAxis);

    regen->setBrush(Qt::red);
    nuclear->setBrush(Qt::green);
    fossil->setBrush(Qt::blue);

    QVector<double> fossilData,nuclearData,regenData;

    fossilData << 0.86*10.5 <<0.83*5.5 <<0.84*5.5 <<0.52*5.8 <<0.89*5.2 <<0.90*4.2 <<0.67*11.2;
    nuclearData << 0.08*10.5 <<0.12*5.5 <<0.12*5.5 <<0.40*5.8 <<0.09*5.2 <<0.00*4.2 <<0.07*11.2;
    regenData << 0.06*10.5 <<0.05*5.5 <<0.04*5.5 <<0.06*5.8 <<0.02*5.2 <<0.07*4.2 <<0.25*11.2;

    fossil->setData(ticks,fossilData);
    nuclear->setData(ticks,nuclearData);
    regen->setData(ticks,regenData);

    regen->setStackingGap(1);//设置堆积在其他柱状图上时的间距(像素)
    nuclear->setStackingGap(1);

    nuclear->moveAbove(fossil);
    regen->moveAbove(nuclear);

}
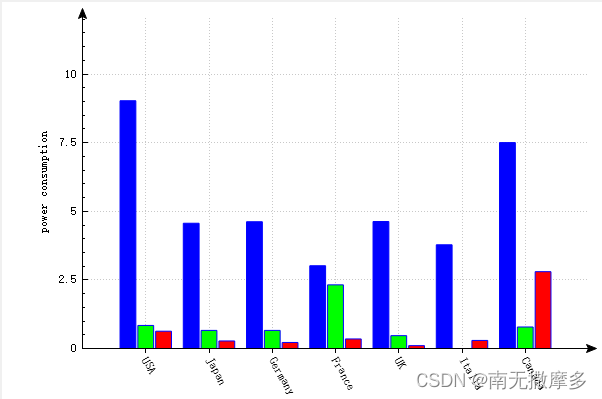
//设置分组柱状图
void myCustomPlot::initMyCustomPlot5()
{//堆积柱状图 和分组柱状图
    QCPAxis *keyAxis = ui->customPlot->xAxis;
    QCPAxis *valueAxis = ui->customPlot->yAxis;
//    QCPBars *fossil = new QCPBars(keyAxis,valueAxis);

//    fossil->setAntialiased(false);//为了更好的边框效果,关闭抗锯齿
//    fossil->setName("Fossil fuels");//设置柱状图的名字,可在图例中显示
//    fossil->setPen(QPen(QColor(0,168,140).lighter(130)));//设置柱状图的边框颜色
//    fossil->setBrush(QColor(0,168,140));//设置柱状图的画刷颜色

    //为柱状图设置一个文字类型的key轴,ticks决定了轴的范围,而labels决定了轴的刻度文字显示
    QVector<double> ticks;
    QVector<QString> labels;
    ticks<<1 <<2 <<3 <<4 <<5 <<6 <<7;
    labels<< "USA" << "Japan" <<"Germany" <<"France" <<"UK"<<"Italia"<<"Canada";
    QSharedPointer<QCPAxisTickerText> textTicker(new QCPAxisTickerText);
    textTicker->addTicks(ticks,labels);

    keyAxis->setTicker(textTicker);

    //设置轴的范围,并为其添加数据
    keyAxis->setTickLabelRotation(60);//轴刻度文字旋转60度
    keyAxis->setSubTicks(false);
    keyAxis->setTickLength(0,4);
    keyAxis->setRange(0,8);
    keyAxis->setUpperEnding(QCPLineEnding::esSpikeArrow);

    valueAxis->setRange(0,12.1);
    valueAxis->setPadding(35);//轴的内边距
    valueAxis->setLabel("power consumption");
    valueAxis->setUpperEnding(QCPLineEnding::esSpikeArrow);


    //为了展示堆积柱状图,再添加两个柱状图
    QCPBars *regen = new QCPBars(keyAxis,valueAxis);
    QCPBars *nuclear = new QCPBars(keyAxis,valueAxis);
    QCPBars *fossil = new QCPBars(keyAxis,valueAxis);

    regen->setBrush(Qt::red);
    nuclear->setBrush(Qt::green);
    fossil->setBrush(Qt::blue);

    QVector<double> fossilData,nuclearData,regenData;

    fossilData << 0.86*10.5 <<0.83*5.5 <<0.84*5.5 <<0.52*5.8 <<0.89*5.2 <<0.90*4.2 <<0.67*11.2;
    nuclearData << 0.08*10.5 <<0.12*5.5 <<0.12*5.5 <<0.40*5.8 <<0.09*5.2 <<0.00*4.2 <<0.07*11.2;
    regenData << 0.06*10.5 <<0.05*5.5 <<0.04*5.5 <<0.06*5.8 <<0.02*5.2 <<0.07*4.2 <<0.25*11.2;

//    fossil->setData(ticks,fossilData);
//    nuclear->setData(ticks,nuclearData);
//    regen->setData(ticks,regenData);

//    regen->setStackingGap(1);//设置堆积在其他柱状图上时的间距(像素)
//    nuclear->setStackingGap(1);

//    nuclear->moveAbove(fossil);
//    regen->moveAbove(nuclear);


    //分组柱状图
    QCPBarsGroup *group = new  QCPBarsGroup(ui->customPlot);
    QList<QCPBars*> bars;
    bars<<fossil << nuclear <<regen;
    foreach(QCPBars* bar,bars){
        //设置柱状图的宽度类型以key坐标轴计算宽度的大小(默认也是此方式)
        bar->setWidthType(QCPBars::wtPlotCoords);
        bar->setWidth(bar->width()/bars.size());//设置柱状图的宽度大小
        group->append(bar);//将柱状图加入柱状图分组中
    }

    group->setSpacingType(QCPBarsGroup::stAbsolute);
    group->setSpacing(2);//设置较小的间距值,这样看起来比较紧凑

    fossil->setData(ticks,fossilData);
    nuclear->setData(ticks,nuclearData);
    regen->setData(ticks,regenData);
}
/*
柱状分组图

柱状图宽度类型和柱状分组图间距类型
柱状图有三种宽度类型,分别是:

QCPBars::wtAbsolute 宽度是绝对像素大小,即setWidth设置为多少就是多少
QCPBars::wtAxisRectRatio 宽度大小是以QCPAxisRect的大小决定的,当key轴为水平的时候,宽度大小为setWidth设置的比例值乘以QCPAxisRect的宽度;key轴为垂直的时候,是乘以QCPAxisRect的高度
QCPBars::wtPlotCoords 宽度大小是以key坐标轴刻度位置以及setWidth设置的值确定,宽度的计算方式为当前key±width
柱状分组图的间距类型和柱状图的宽度类型是类似的
*/
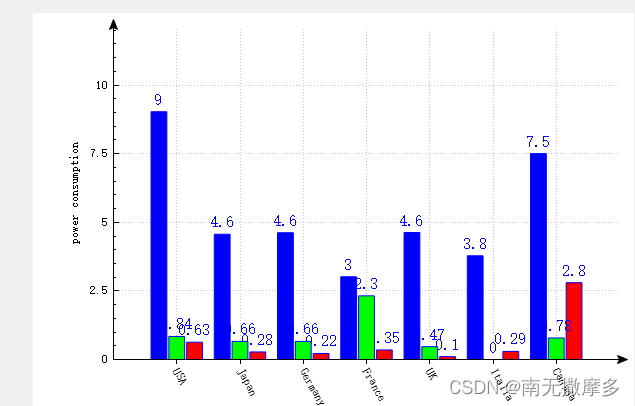
//柱状图上面标注具体值
/*
自定义一个继承于QCPBars的一个类,并重写其虚函数draw();用法:仅仅将创建柱状图的代码类型换为自定义的类型即可.
【疑问】:被重写的draw()方法没有调用直接就起作用了,why? 虽然是虚函数且继承时候重写了,但是创建对象时候仅仅是创建了个对象,并没有显示的调用该方法呀,咋能起作用呢?就算是多态那也要调用才可以起作用呀。
【注意】写程序时候注意:尽量避免下面这种直接在程序的局部new 一个仅仅指针也是局部的对象,这样不好进行delete,若是初始化之后离开此函数没法进行delete,则会造成内存泄露,若是在此函数内部delete,那么之前的工作全部失效。
*/
void myCustomPlot::initMyCustomPlot5()
{//堆积柱状图 和分组柱状图
    QCPAxis *keyAxis = ui->customPlot->xAxis;
    QCPAxis *valueAxis = ui->customPlot->yAxis;
//    QCPBars *fossil = new QCPBars(keyAxis,valueAxis);

//    fossil->setAntialiased(false);//为了更好的边框效果,关闭抗锯齿
//    fossil->setName("Fossil fuels");//设置柱状图的名字,可在图例中显示
//    fossil->setPen(QPen(QColor(0,168,140).lighter(130)));//设置柱状图的边框颜色
//    fossil->setBrush(QColor(0,168,140));//设置柱状图的画刷颜色

    //为柱状图设置一个文字类型的key轴,ticks决定了轴的范围,而labels决定了轴的刻度文字显示
    QVector<double> ticks;
    QVector<QString> labels;
    ticks<<1 <<2 <<3 <<4 <<5 <<6 <<7;
    labels<< "USA" << "Japan" <<"Germany" <<"France" <<"UK"<<"Italia"<<"Canada";
    QSharedPointer<QCPAxisTickerText> textTicker(new QCPAxisTickerText);
    textTicker->addTicks(ticks,labels);

    keyAxis->setTicker(textTicker);

    //设置轴的范围,并为其添加数据
    keyAxis->setTickLabelRotation(60);//轴刻度文字旋转60度
    keyAxis->setSubTicks(false);
    keyAxis->setTickLength(0,4);
    keyAxis->setRange(0,8);
    keyAxis->setUpperEnding(QCPLineEnding::esSpikeArrow);

    valueAxis->setRange(0,12.1);
    valueAxis->setPadding(35);//轴的内边距
    valueAxis->setLabel("power consumption");
    valueAxis->setUpperEnding(QCPLineEnding::esSpikeArrow);


    //为了展示堆积柱状图,再添加两个柱状图
//    QCPBars *regen = new QCPBars(keyAxis,valueAxis);
//    QCPBars *nuclear = new QCPBars(keyAxis,valueAxis);
//    QCPBars *fossil = new QCPBars(keyAxis,valueAxis);

    //可以在柱状条上面显示具体的数据的类,CustomBars继承于QCPBars并重写其虚函数draw()
    CustomBars *regen = new CustomBars(keyAxis,valueAxis);
    CustomBars *nuclear = new CustomBars(keyAxis,valueAxis);
    CustomBars *fossil = new CustomBars(keyAxis,valueAxis);

    regen->setBrush(Qt::red);
    nuclear->setBrush(Qt::green);
    fossil->setBrush(Qt::blue);
//QCPPainter *painter = new QCPPainter();

    QVector<double> fossilData,nuclearData,regenData;

    fossilData << 0.86*10.5 <<0.83*5.5 <<0.84*5.5 <<0.52*5.8 <<0.89*5.2 <<0.90*4.2 <<0.67*11.2;
    nuclearData << 0.08*10.5 <<0.12*5.5 <<0.12*5.5 <<0.40*5.8 <<0.09*5.2 <<0.00*4.2 <<0.07*11.2;
    regenData << 0.06*10.5 <<0.05*5.5 <<0.04*5.5 <<0.06*5.8 <<0.02*5.2 <<0.07*4.2 <<0.25*11.2;

//    fossil->setData(ticks,fossilData);
//    nuclear->setData(ticks,nuclearData);
//    regen->setData(ticks,regenData);

//    regen->setStackingGap(1);//设置堆积在其他柱状图上时的间距(像素)
//    nuclear->setStackingGap(1);

//    nuclear->moveAbove(fossil);
//    regen->moveAbove(nuclear);


    //分组柱状图
    QCPBarsGroup *group = new  QCPBarsGroup(ui->customPlot);
    QList<QCPBars*> bars;
    bars<<fossil << nuclear <<regen;
    foreach(QCPBars* bar,bars){
        //设置柱状图的宽度类型以key坐标轴计算宽度的大小(默认也是此方式)
        bar->setWidthType(QCPBars::wtPlotCoords);
        bar->setWidth(bar->width()/bars.size());//设置柱状图的宽度大小
        group->append(bar);//将柱状图加入柱状图分组中
         //bar->setBaseValue(2.5);//设置柱状图的起点为value轴值为2.5的位置
    }

    group->setSpacingType(QCPBarsGroup::stAbsolute);
    group->setSpacing(2);//设置较小的间距值,这样看起来比较紧凑

    fossil->setData(ticks,fossilData);
    nuclear->setData(ticks,nuclearData);
    regen->setData(ticks,regenData);
}

/*****************CustomBar源文件*********************/
#include "CustomBars.h"


CustomBars::CustomBars(QCPAxis *keyAxis, QCPAxis *valueAxis)
    :QCPBars (keyAxis,valueAxis)
    ,mTextAlignment(Qt::AlignCenter)
    ,mSpacing(5)
    ,mFont(QFont(QLatin1String("sans serif"),12))
{

}

void CustomBars::setTextAlignment(Qt::Alignment alignment)
{
    mTextAlignment = alignment;
}

void CustomBars::setSpacing(double spacing)
{
    mSpacing = spacing;
}

void CustomBars::setFont(const QFont &font)
{
    mFont = font;
}

void CustomBars::draw(QCPPainter *painter)
{
    if (!mKeyAxis || !mValueAxis) { qDebug() << Q_FUNC_INFO << "invalid key or value axis"; return; }
    if (mDataContainer->isEmpty()) return;

    QCPBarsDataContainer::const_iterator visibleBegin, visibleEnd;
    getVisibleDataBounds(visibleBegin, visibleEnd);

    // loop over and draw segments of unselected/selected data:
    QList<QCPDataRange> selectedSegments, unselectedSegments, allSegments;
    getDataSegments(selectedSegments, unselectedSegments);
    allSegments << unselectedSegments << selectedSegments;
    for (int i=0; i<allSegments.size(); ++i)
    {
      bool isSelectedSegment = i >= unselectedSegments.size();
      QCPBarsDataContainer::const_iterator begin = visibleBegin;
      QCPBarsDataContainer::const_iterator end = visibleEnd;
      mDataContainer->limitIteratorsToDataRange(begin, end, allSegments.at(i));
      if (begin == end)
        continue;

      for (QCPBarsDataContainer::const_iterator it=begin; it!=end; ++it)
      {
        // check data validity if flag set:
  #ifdef QCUSTOMPLOT_CHECK_DATA
        if (QCP::isInvalidData(it->key, it->value))
          qDebug() << Q_FUNC_INFO << "Data point at" << it->key << "of drawn range invalid." << "Plottable name:" << name();
  #endif
        // draw bar:
        if (isSelectedSegment && mSelectionDecorator)
        {
          mSelectionDecorator->applyBrush(painter);
          mSelectionDecorator->applyPen(painter);
        } else
        {
          painter->setBrush(mBrush);
          painter->setPen(mPen);
        }
        applyDefaultAntialiasingHint(painter);
        painter->drawPolygon(getBarRect(it->key, it->value));

        /**********以下是添加的代码**************/
    //计算文字的位置
        painter->setFont(mFont);//设置字体
        QString text = QString::number(it->value,'g',2);//取得当前value轴的值,保留两位精度

        QRectF textRect = painter->fontMetrics().
       boundingRect(0,0,0,0,Qt::TextDontClip | mTextAlignment,text);//计算文字所占用的大小

        if(mKeyAxis.data()->orientation() == Qt::Horizontal){//当key轴为水平轴的时候

            if(mKeyAxis.data()->axisType() == QCPAxis::atTop)//上轴,移动文字到柱状图下面
                //textRect.moveTopLeft(barRect.bottomLeft() + QPointF(0,mSpacing));
                textRect.moveTopLeft(getBarRect(it->key, it->value).bottomLeft() + QPointF(0,mSpacing));
            else//下轴,移动文字到柱状图上面
                textRect.moveBottomLeft(getBarRect(it->key, it->value).topLeft() - QPointF(0,mSpacing));
            textRect.setWidth(getBarRect(it->key,it->value).width());
            painter->drawText(textRect,Qt::TextDontClip | mTextAlignment,text);


        } else {//当key轴为垂直轴的时候
            if(mKeyAxis.data()->axisType() == QCPAxis::atLeft)//左轴,移动文字到柱状图右边
                textRect.moveTopLeft(getBarRect(it->key, it->value).topRight() + QPointF(mSpacing,0));
            else//右轴,移动文字到柱状图的左边
                textRect.moveTopRight(getBarRect(it->key, it->value).bottomLeft() - QPointF(mSpacing,0));
            textRect.setHeight(getBarRect(it->key,it->value).height());
            painter->drawText(textRect,Qt::TextDontClip | mTextAlignment,text);

    }


        /**********以上是添加的代码**************/
      }
    }

    // draw other selection decoration that isn't just line/scatter pens and brushes:
    if (mSelectionDecorator)
      mSelectionDecorator->drawDecoration(painter, selection());
}

/*****************CustomBar头文件***************/
#ifndef CUSTOMBARS_H
#define CUSTOMBARS_H

#include "qcustomplot.h"

class CustomBars : public QCPBars
{
public:
    explicit CustomBars(QCPAxis *keyAxis,QCPAxis *valueAxis);
    Qt::Alignment textAlignment() const {return mTextAlignment;}
    double spacing() const {return mSpacing;}
    QFont font() const {return mFont;}

    void setTextAlignment(Qt::Alignment alignment);
    void setSpacing(double spacing);
    void setFont(const QFont &font);

protected:
        Qt::Alignment mTextAlignment;//文字对齐方式
        double mSpacing; //文字与柱状图的间距,这里按像素大小
        QFont mFont;//文字使用的字体
        virtual void draw(QCPPainter *painter) Q_DECL_OVERRIDE;
};

#endif // CUSTOMBARS_H
折线图
#include <QtMath>
/*模仿并发挥的*/
void myCustomPlot::initMyCustomPlot6()
{//绘制折线

    QCustomPlot *customPlot = ui->customPlot;
    QCPAxis *keysAxis = customPlot->xAxis;
    QCPAxis *valuesAxis  = customPlot->yAxis;
    QCPGraph *graph = new QCPGraph(keysAxis,valuesAxis);
    QCPGraph *graph1 = new QCPGraph(keysAxis,valuesAxis);

    QVector<double> ticks0,lineDatay0;
    QVector<double> ticks1,lineDatay1;

    keysAxis->setRange(-11,11);
    keysAxis->setTickPen(QColor(Qt::red));
    keysAxis->setLabel(QString("x轴"));
    keysAxis->setTicks(true);
    keysAxis->setSubTicks(true);
    keysAxis->grid()->setPen(QPen(Qt::blue));
    keysAxis->grid()->setZeroLinePen(QPen(Qt::red));
    keysAxis->setUpperEnding(QCPLineEnding::esLineArrow);

    valuesAxis->setRange(-25,100);
    valuesAxis->setTickPen(QColor(Qt::black));
    valuesAxis->setLabel(QString("y轴"));
    valuesAxis->setSubTicks(true);
    valuesAxis->setTicks(true);
    valuesAxis->grid()->setPen(QPen(Qt::green));
    valuesAxis->grid()->setSubGridPen(QPen(Qt::gray));
    valuesAxis->grid()->setSubGridVisible(true);
    valuesAxis->grid()->setVisible(true);
    valuesAxis->setUpperEnding(QCPLineEnding::esFlatArrow);


    for(int i=-10;i<=10;i++){
        ticks0 <<i;
        lineDatay0 <<i*i;
    }
    for(int i=-10;i<=10;i++){
        ticks1<< i;
        lineDatay1<<20*qSin(i);
    }

    graph->setData(ticks0,lineDatay0);
    graph1->setData(ticks1,lineDatay1);


   //customPlot->replot();//好像没啥用

}

/*QCustomPlot官网上的例子1*/
void myCustomPlot::initMyCustomPlot7()
{
    QCustomPlot *customPlot = ui->customPlot;
    customPlot->addGraph();
    customPlot->graph(0)->setPen(QPen(Qt::blue));
    customPlot->graph(0)->setBrush(QBrush(QColor(0,0,255,20)));
    customPlot->addGraph();
    customPlot->graph(1)->setPen(QPen(Qt::red));

    QVector<double> x(251),y0(251),y1(251);
    for(int i=0;i<251;++i){
        x[i] = i;
        y0[i] = qExp(-i/150.0)*qCos(i/10.0);
        y1[i] = qExp(-i/150.0);
    }

    customPlot->xAxis2->setVisible(true);
    customPlot->xAxis2->setTickLabels(false);
    customPlot->yAxis2->setVisible(true);
    customPlot->yAxis2->setTickLabels(false);

    connect(customPlot->xAxis,SIGNAL(rangeChanged(QCPRange)),
            customPlot->xAxis2,SLOT(setRange(QCPRange)));
    connect(customPlot->yAxis,SIGNAL(rangeChanged(QCPRange)),
            customPlot->yAxis2,SLOT(setRange(QCPRange)));

    customPlot->graph(0)->setData(x,y0);
    customPlot->graph(1)->setData(x,y1);

    customPlot->graph(0)->rescaleAxes();
    customPlot->graph(1)->rescaleAxes(true);
    customPlot->setInteractions(QCP::iRangeDrag |QCP::iRangeZoom |
                                QCP::iSelectPlottables);
//    customPlot->setInteractions(QCP::iRangeDrag |QCP::iRangeZoom );

}
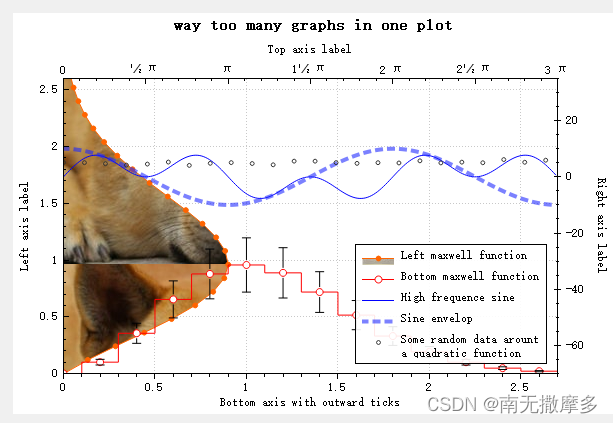
- 一个坐标系,多个图线
void myCustomPlot::initMyCustomPlot8()
{//
    QCustomPlot *customPlot = ui->customPlot;
    customPlot->setLocale(QLocale(QLocale::English,
                                  QLocale::UnitedKingdom));
    customPlot->legend->setVisible(true);
    QFont legendFont = font();
    legendFont.setPointSize(9);
    customPlot->legend->setFont(legendFont);
    customPlot->legend->setBrush(QBrush(QColor(255,255,255,230)));
    customPlot->axisRect()->insetLayout()->
            setInsetAlignment(0,Qt::AlignBottom |Qt::AlignRight);

    customPlot->addGraph(customPlot->yAxis,customPlot->xAxis);
    customPlot->graph(0)->setPen(QPen(QColor(255,100,0)));
    customPlot->graph(0)->setBrush(QBrush(QPixmap(":/images/icons/103.bmp")));
    customPlot->graph(0)->setLineStyle(QCPGraph::lsLine);
    customPlot->graph(0)->setScatterStyle(QCPScatterStyle(QCPScatterStyle::ssDisc,5));
    customPlot->graph(0)->setName("Left maxwell function");

    customPlot->addGraph();//默认坐标轴:key--bottom value--left
    customPlot->graph(1)->setPen(QPen(Qt::red));
    customPlot->graph(1)->setBrush(QBrush(QPixmap(":/images/icons/102.bmp")));
    customPlot->graph(1)->setLineStyle(QCPGraph::lsStepCenter);
    customPlot->graph(1)->setScatterStyle(QCPScatterStyle
               (QCPScatterStyle::ssCircle,Qt::red,Qt::white,7));
    customPlot->graph(1)->setName("Bottom maxwell function");
    QCPErrorBars *errorBars = new QCPErrorBars(customPlot->xAxis,customPlot->yAxis);
    errorBars->removeFromLegend();
    errorBars->setDataPlottable(customPlot->graph(1));

    customPlot->addGraph(customPlot->xAxis2,customPlot->yAxis2);
    customPlot->graph(2)->setPen(QPen(Qt::blue));
    customPlot->graph(2)->setName("High frequence sine");

    customPlot->addGraph(customPlot->xAxis2,customPlot->yAxis2);
    QPen blueDotPen;
    blueDotPen.setColor(QColor(30,40,255,150));
    blueDotPen.setStyle(Qt::DotLine);
    blueDotPen.setWidthF(4);
    customPlot->graph(3)->setPen(blueDotPen);
    customPlot->graph(3)->setName("Sine envelop");

   customPlot->addGraph(customPlot->xAxis2,customPlot->yAxis2);
   customPlot->graph(4)->setPen(QPen(QColor(50,50,50,255)));
   customPlot->graph(4)->setLineStyle(QCPGraph::lsNone);
   customPlot->graph(4)->setScatterStyle(QCPScatterStyle(QCPScatterStyle::ssCircle,4));
   customPlot->graph(4)->setName("Some random data arount\na quadratic function");


   //数据
   QVector<double> x0(25),y0(25);
   QVector<double> x1(15),y1(15),ylerr(15);
   QVector<double> x2(250),y2(250);
   QVector<double> x3(250),y3(250);
   QVector<double> x4(250),y4(250);

   for(int i=0;i<25;++i){// data for graph0
       x0[i] = 3*i/25.0;
       y0[i] = qExp(-x0[i]*x0[i]*0.8)*(x0[i]*x0[i]+x0[i]);
   }

   for(int i=0;i<15;++i){//data for graph1
       x1[i] = 3*i/15.0;
       y1[i] = qExp(-x1[i]*x1[i])*(x1[i]*x1[i])*2.6;
       ylerr[i] = y1[i]*0.25;
   }

   for(int i=0;i<250;++i){
       x2[i] = i/250.0*3*M_PI;
       x3[i] = x2[i];
       x4[i] = i/250.0*100-50;
       y2[i] = qSin(x2[i]*2)*qCos(x2[i])*10;
       y3[i] = qCos(x3[i])*10;
       y4[i] = 0.01*x4[i]*x4[i] + 1.5*(rand()/(double)RAND_MAX -0.5)+1.5*M_PI;

   }


   customPlot->graph(0)->setData(x0,y0);
   customPlot->graph(1)->setData(x1,y1);
   errorBars->setData(ylerr);
   customPlot->graph(2)->setData(x2,y2);
   customPlot->graph(3)->setData(x3,y3);
   customPlot->graph(4)->setData(x4,y4);

   customPlot->xAxis2->setVisible(true);
   customPlot->yAxis2->setVisible(true);

   customPlot->xAxis->setRange(0,2.7);
   customPlot->yAxis->setRange(0,2.6);
   customPlot->xAxis2->setRange(0,3.0*M_PI);
   customPlot->yAxis2->setRange(-70,35);

   //set pi ticks on top axis
   customPlot->xAxis2->setTicker(QSharedPointer<QCPAxisTickerPi>(new QCPAxisTickerPi));
   //add title layout element
   customPlot->plotLayout()->insertRow(0);
   customPlot->plotLayout()->addElement(0,0,
     new QCPTextElement(customPlot,"way too many graphs in one plot",
                         QFont("sans",12,QFont::Bold)));

   //set lables:
   customPlot->xAxis->setLabel("Bottom axis with outward ticks");
   customPlot->yAxis->setLabel("Left axis label");
   customPlot->xAxis2->setLabel("Top axis label");
   customPlot->yAxis2->setLabel("Right axis label");

   //make ticks on bottom axis go outward:
   customPlot->xAxis->setTickLength(0,5);
   customPlot->xAxis->setSubTickLength(0,3);
   //make ticks on right axis go inward and outward:
   customPlot->yAxis2->setTickLength(3,3);
   customPlot->yAxis2->setSubTickLength(1,1);

    //添加
   customPlot->setInteractions(QCP::iRangeDrag
                               |QCP::iRangeZoom
                               |QCP::iMultiSelect
                               | QCP::iSelectPlottables
                               |QCP::iSelectAxes
                               |QCP::iSelectLegend
                               |QCP::iSelectItems
                               |QCP::iSelectOther
                               |QCP::iSelectPlottablesBeyondAxisRect
                               );
}
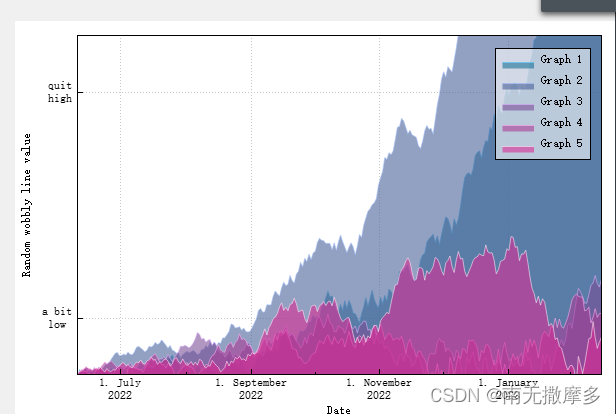
//Plotting date and time data

void myCustomPlot::initMyCustomPlot9()
{//plotting data and time data

   QCustomPlot *customPlot = ui->customPlot;

   customPlot->setLocale(QLocale(QLocale::English,QLocale::UnitedKingdom));
   double now = QDateTime::currentDateTime().toTime_t();
   srand(8);
   //create multiple graphs:
   for(int gi=0;gi<5;++gi){
       customPlot->addGraph();
       QColor color(20+200/4.0*gi,70*(1.6-gi/4.0),150,150);
       customPlot->graph()->setLineStyle(QCPGraph::lsLine);
       customPlot->graph()->setPen(QPen(color.lighter(200)));
       customPlot->graph()->setBrush(QBrush(color));
       //generate random walk data:
       QVector<QCPGraphData> timeData(250);
       for(int i=0;i<250;++i){
           timeData[i].key = now +24*3600*i;
           if(i==0)
               timeData[i].value = (i/50.0+1)*(rand()/(double)RAND_MAX - 0.5);
           else
           {
               timeData[i].value = qFabs(timeData[i-1].value)*(1+0.02/4.0*(4-gi))
                       +(i/50.0+1)*(rand()/(double)RAND_MAX-0.5);
            }
       }
       customPlot->graph()->data()->set(timeData);

   }

   //configure bottom axis to show date instand of number
   QSharedPointer<QCPAxisTickerDateTime> dateTicker(new QCPAxisTickerDateTime);
   dateTicker->setDateTimeFormat("d. MMMM\nyyyy");
   customPlot->xAxis->setTicker(dateTicker);
   //configure left axis text label:
   QSharedPointer<QCPAxisTickerText> textTicker(new QCPAxisTickerText);
   textTicker->addTick(10,"a bit\nlow");
   textTicker->addTick(50,"quit \nhigh");
   customPlot->yAxis->setTicker(textTicker);

   customPlot->xAxis->setTickLabelFont(QFont(QFont().family(),8));
   customPlot->yAxis->setTickLabelFont(QFont(QFont().family(),8));

   customPlot->xAxis->setLabel("Date");
   customPlot->yAxis->setLabel("Random wobbly line value");

   customPlot->xAxis2->setVisible(true);
   customPlot->yAxis2->setVisible(true);
   customPlot->xAxis2->setTicks(false);
   customPlot->yAxis2->setTicks(false);
   customPlot->xAxis2->setTickLabels(false);
   customPlot->yAxis2->setTickLabels(false);

   //set axis ranges to show all datas
   customPlot->xAxis->setRange(now,now+24*3600*249);
   customPlot->yAxis->setRange(0,60);
   //show legend with slightly transparent background brush:
   customPlot->legend->setVisible(true);
   customPlot->legend->setBrush(QColor(255,255,255,150));
}
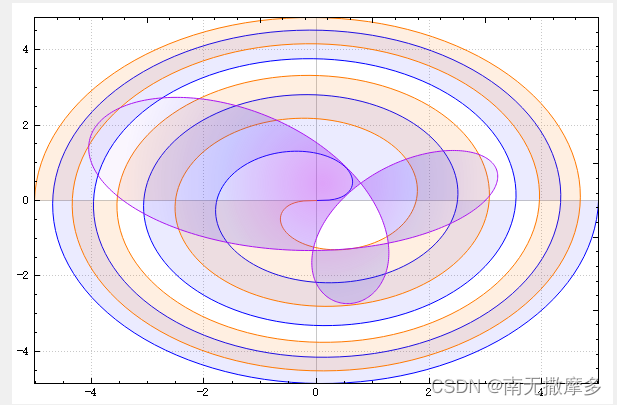
曲线
//绘制曲线图

    //官方例子绘制curve
    QCustomPlot *customPlot = ui->customPlot;
    QString demoName = "XG Curve practice";
    //创建曲线图 参数方程 create empty curve object
    QCPCurve *fermateSpiral1 =new QCPCurve(customPlot->xAxis,customPlot->yAxis);
    QCPCurve *fermateSpiral2 = new QCPCurve(customPlot->xAxis,customPlot->yAxis);
    QCPCurve *deltiodRadial = new QCPCurve(customPlot->xAxis,customPlot->yAxis);

    //数据
    const int pointCount = 500;

    //创建参数方程数据集
    QVector<QCPCurveData> dataSprial1(pointCount),dataSprial2(pointCount),dataDeltiod(pointCount);
    for(int i=0;i<pointCount;++i)
    {
        double phi = i/(double)(pointCount-1)*8*M_PI;
        double theta = i/(double)(pointCount-1)*2*M_PI;
        dataSprial1[i] = QCPCurveData(i,qSqrt(phi)*qCos(phi),qSqrt(phi)*qSin(phi));
        dataSprial2[i] = QCPCurveData(i,-dataSprial1[i].key,-dataSprial1[i].value);
        dataDeltiod[i] = QCPCurveData(i,2*qCos(2*theta)+qCos(1*theta)+2*qSin(theta),2*qSin(2*theta)-qSin(1*theta));

    }

    //pass the data to the curves;we know t (i in loop above)is ascending,so set alreadySorted=true(saves an extral internal sort):
    //填充数据至curv Plot
    fermateSpiral1->data()->set(dataSprial1,true);
    fermateSpiral2->data()->set(dataSprial2,true);
    deltiodRadial->data()->set(dataDeltiod,true);
    //color the curves
    fermateSpiral1->setPen(QPen(Qt::blue));
    fermateSpiral1->setBrush(QBrush(QColor(0,0,255,20)));
    fermateSpiral2->setPen(QPen(QColor(255,120,0)));
    fermateSpiral2->setBrush(QBrush(QColor(255,120,0,30)));

    QRadialGradient radialGrad(QPointF(310,180),200);
    radialGrad.setColorAt(0,QColor(170,20,240,100));
    radialGrad.setColorAt(0.5,QColor(20,10,255,40));
    radialGrad.setColorAt(1,QColor(120,20,240,10));
    deltiodRadial->setPen(QPen(QColor(170,20,240)));
    deltiodRadial->setBrush(QBrush(radialGrad));

    //set some basic customPlot config:
    customPlot->setInteractions(QCP::iRangeDrag| QCP::iRangeZoom |QCP::iSelectPlottables);
    customPlot->axisRect()->setupFullAxesBox();
    customPlot->rescaleAxes();
发布者:全栈程序员-用户IM,转载请注明出处:https://javaforall.cn/183563.html原文链接:https://javaforall.cn
【正版授权,激活自己账号】: Jetbrains全家桶Ide使用,1年售后保障,每天仅需1毛
【官方授权 正版激活】: 官方授权 正版激活 支持Jetbrains家族下所有IDE 使用个人JB账号...
