大家好,又见面了,我是你们的朋友全栈君。如果您正在找激活码,请点击查看最新教程,关注关注公众号 “全栈程序员社区” 获取激活教程,可能之前旧版本教程已经失效.最新Idea2022.1教程亲测有效,一键激活。
Jetbrains全系列IDE稳定放心使用
浅谈Oracle RAC –集群管理软件GI基本架构
今天周五,想想可以过周末,心情大好。一周中最喜欢过的就是周五晚上,最不喜欢过的是周日晚上和周一,看来我不是个热爱劳动的人啊。趁着现在心情愉悦,赶紧坐下来继续写我的博客吧。
昨天的博客里,我介绍了什么是 Oracle RAC。还没有看过的同学可以回过头去参考一下。我们说从实现技术上来说 Oracle RAC 是基于集群管理软件构建出的数据库。那么研究Oracle RAC 的基础则是要搞懂集群管理软件的原理。
昨天的博客里我们介绍了现在甲骨文早已不再依托第三方集群管理软件,而拥有了自己的,标准化的,强大集群管理软件 —- Grid Infrastructure(GI)。
1.GI的基本架构
我们以19c为例先来看一下GI都是由哪些组件和资源构成。
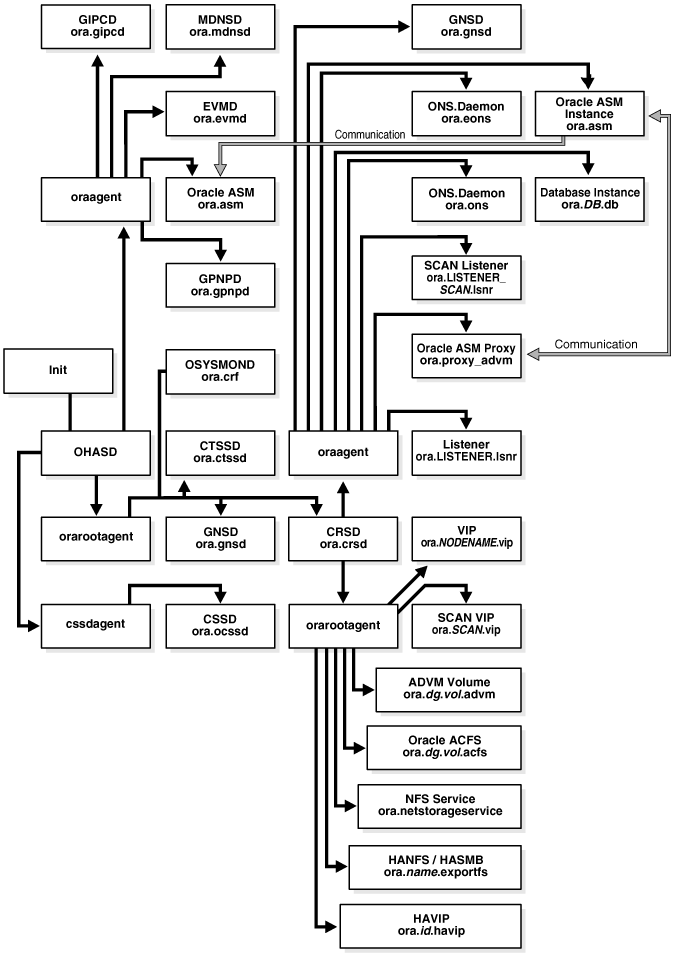

看完上面的图,可能很多同学会被吓到,GI是不是太多组件和资源了。其实大可不必担心,但凡一些大的架构一定是层次分的比较清晰的。只要我们掌握了这些层次关系,这张图就变得简单了。
长话短说,我们先把GI的核心组件摘出来。
1.1 OHASD
OHASD是集群启动守护进程。从上图我们可以看到,OHASD启动了三个以agent结尾的进程,我们称之为代理进程。这些代理进程实际上就是用来启动/停止/监控所管辖的组件或者资源的。这就好像OHASD是个董事长,下面派了三个经理去分别负责管理不同部门的概念。
在OHASD的代理进程管理的众多组件和资源中,有几个核心组件,他们分别是CSSD,CRSD。
1.2 CSSD
这个组件是负责构建集群,并且维护集群的一致性的。集群之所以称之为集群,一定是通过某些机制将不同的计算机联系到一起的。CSSD 就是维护集群一致性的核心组件。
每个节点都有CSSD守护进程,这些进程间会通过私网进行通信,并且定期向其它节点发送网络心跳,以此来确认不同节点间的通信状态。同时各个节点的CSSD还会定期向共享磁盘发送磁盘心跳,以保证所有成员节点都可以IO读写共同的磁盘。
1.3 CRSD
这个组件主要负责管理集群中的资源。
我们看上面的那张图,CRSD 也会生成代理进程。这些代理进程会去管理很多以ora开头的资源。这里需要强调的是,并不是所有资源都是以ora开头的。一般说以ora开头的资源是Oracle自带的资源。而客户自定义的资源则不一定以ora开头。
我们仔细看一下CRSD管理的资源,是不是发现了ora.DB.db这个资源名。没错这个就是Oracle RAC 实例在集群中的表现形式。Oracle RAC 数据库实例是以资源的形式被 CRSD 组件所管理。这里面的DB 是你所创建的数据库的名。
把上面的三个核心组件抓出来之后,我们再来捋顺一下代理进程。
他们分别是:
1.1 OHASD 启动的 orarootagent, cssdagent 和 oraagent。
1.2 CRSD 启动的 orarootagent 和 oraagent。
从上面可以知道代理进程只能由OHASD和CRSD生成,其它的组件都不会生成代理进程。
把这三个重要组件摘出来,然后顺着代理进程下辖的组件或者资源再去理解这张图是不是就显得没有那么复杂了。
当然这里面的组件和资源都有其独特的作用,我们在以后会找时间扩展开来讲。
2.GI的启动
接下来让我们启动GI,然后查看一下启动的顺序如何。
GI的启动命令是 crsctl start crs。我在后面加了 -wait 是为了打印启动信息到屏幕上。如果不加 -wait 是没有任何信息输出的。crsctl的执行权限是root用户。
[root@node1 ~]#crsctl start crs -wait
CRS-4123: Starting Oracle High Availability Services-managed resources
CRS-2672: Attempting to start 'ora.mdnsd' on 'node1'
CRS-2672: Attempting to start 'ora.evmd' on 'node1'
CRS-2676: Start of 'ora.mdnsd' on 'node1' succeeded
CRS-2676: Start of 'ora.evmd' on 'node1' succeeded
CRS-2672: Attempting to start 'ora.gpnpd' on 'node1'
CRS-2676: Start of 'ora.gpnpd' on 'node1' succeeded
CRS-2672: Attempting to start 'ora.gipcd' on 'node1'
CRS-2676: Start of 'ora.gipcd' on 'node1' succeeded
CRS-2672: Attempting to start 'ora.crf' on 'node1'
CRS-2672: Attempting to start 'ora.cssdmonitor' on 'node1'
CRS-2676: Start of 'ora.cssdmonitor' on 'node1' succeeded
CRS-2672: Attempting to start 'ora.cssd' on 'node1'
CRS-2672: Attempting to start 'ora.diskmon' on 'node1'
CRS-2676: Start of 'ora.diskmon' on 'node1' succeeded
CRS-2676: Start of 'ora.crf' on 'node1' succeeded
CRS-2676: Start of 'ora.cssd' on 'node1' succeeded
CRS-2672: Attempting to start 'ora.cluster_interconnect.haip' on 'node1'
CRS-2672: Attempting to start 'ora.ctssd' on 'node1'
CRS-2676: Start of 'ora.ctssd' on 'node1' succeeded
CRS-2676: Start of 'ora.cluster_interconnect.haip' on 'node1' succeeded
CRS-2672: Attempting to start 'ora.asm' on 'node1'
CRS-2676: Start of 'ora.asm' on 'node1' succeeded
CRS-2672: Attempting to start 'ora.storage' on 'node1'
CRS-2676: Start of 'ora.storage' on 'node1' succeeded
CRS-2672: Attempting to start 'ora.crsd' on 'node1'
CRS-2676: Start of 'ora.crsd' on 'node1' succeeded
CRS-6023: Starting Oracle Cluster Ready Services-managed resources
CRS-6017: Processing resource auto-start for servers: node1
CRS-2672: Attempting to start 'ora.ons' on 'node1'
CRS-2672: Attempting to start 'ora.chad' on 'node1'
CRS-2676: Start of 'ora.chad' on 'node1' succeeded
CRS-2676: Start of 'ora.ons' on 'node1' succeeded
CRS-2672: Attempting to start 'ora.DATA.dg' on 'node1'
CRS-2676: Start of 'ora.DATA.dg' on 'node1' succeeded
CRS-2672: Attempting to start 'ora.orcl.db' on 'node1'
CRS-2676: Start of 'ora.orcl.db' on 'node1' succeeded
CRS-2672: Attempting to start 'ora.orcl.orcltest.svc' on 'node1'
CRS-2676: Start of 'ora.orcl.orcltest.svc' on 'node1' succeeded
CRS-6016: Resource auto-start has completed for server node1
CRS-6024: Completed start of Oracle Cluster Ready Services-managed resources
CRS-4123: Oracle High Availability Services has been started.
从上面的输出信息,我们首先看到了CRS-4123。
CRS-4123: Starting Oracle High Availability Services-managed resources
从这个内容看,我们能看出要去启动OHAS管理的资源。紧接着输出了OHAS所管理的组件和资源的启动信息。这里面我们可以看到我们最关心的CSSD和CRSD被启动了。
CRS-2676: Start of 'ora.cssd' on 'node1' succeeded
CRS-2676: Start of 'ora.crsd' on 'node1' succeeded
紧接着我们看到了CRS-6023的输出。
CRS-6023: Starting Oracle Cluster Ready Services-managed resources
CRS-6023信息的内容看,接下来要去启动CRSD所管理的资源。紧接着数据库资源ora.orcl.db等都被启动。
当启动成功后,会输出下面的信息。
CRS-4123: Oracle High Availability Services has been started
从上面的信息输出我们可以看到GI的启动分两个大模块。一个是OHASD管理的资源启动模块,一个是CRSD管理的资源启动模块。
通过上面的启动输出信息再匹配上面的那张构造图,是不是我们能更清晰的理解GI的基本框架了。
3.GI相关的进程确认
我们上面不管是说组件还是资源,在OS上表现出来肯定都是各种进程。
通过ps命令我们可以看到GI的主要进程。
[root@node1 ~]# ps -ef | grep /u01/64bit/app/19.3.0/grid/bin/
root     24048     1  3 11:53 ?        00:00:48 /u01/64bit/app/19.3.0/grid/bin/ohasd.bin reboot _ORA_BLOCKING_STACK_LOCALE=AMERICAN_AMERICA.US7ASCII
root     24452     1  0 11:54 ?        00:00:12 /u01/64bit/app/19.3.0/grid/bin/orarootagent.bin
grid     24629     1  1 11:54 ?        00:00:13 /u01/64bit/app/19.3.0/grid/bin/oraagent.bin
grid     24674     1  0 11:54 ?        00:00:06 /u01/64bit/app/19.3.0/grid/bin/mdnsd.bin
grid     24676     1  1 11:54 ?        00:00:17 /u01/64bit/app/19.3.0/grid/bin/evmd.bin
grid     24755     1  0 11:54 ?        00:00:07 /u01/64bit/app/19.3.0/grid/bin/gpnpd.bin
grid     24832 24676  0 11:54 ?        00:00:06 /u01/64bit/app/19.3.0/grid/bin/evmlogger.bin -o /u01/64bit/app/19.3.0/grid/log/[HOSTNAME]/evmd/evmlogger.info -l /u01/64bit/app/19.3.0/grid/log/[HOSTNAME]/evmd/evmlogger.log
grid     24892     1  1 11:54 ?        00:00:16 /u01/64bit/app/19.3.0/grid/bin/gipcd.bin
root     25139     1  0 11:54 ?        00:00:07 /u01/64bit/app/19.3.0/grid/bin/cssdmonitor
root     25142     1  4 11:54 ?        00:01:00 /u01/64bit/app/19.3.0/grid/bin/osysmond.bin
root     25191     1  0 11:54 ?        00:00:07 /u01/64bit/app/19.3.0/grid/bin/cssdagent
grid     25249     1  3 11:54 ?        00:00:44 /u01/64bit/app/19.3.0/grid/bin/ocssd.bin
root     25839     1  1 11:54 ?        00:00:17 /u01/64bit/app/19.3.0/grid/bin/octssd.bin reboot
root     26294     1  2 11:54 ?        00:00:27 /u01/64bit/app/19.3.0/grid/bin/crsd.bin reboot
root     26857     1  1 11:55 ?        00:00:22 /u01/64bit/app/19.3.0/grid/bin/orarootagent.bin
grid     27514     1  2 11:55 ?        00:00:26 /u01/64bit/app/19.3.0/grid/bin/oraagent.bin
grid     27651     1  0 11:55 ?        00:00:00 /u01/64bit/app/19.3.0/grid/bin/tnslsnr LISTENER -no_crs_notify -inherit
grid     27757     1  0 11:55 ?        00:00:00 /u01/64bit/app/19.3.0/grid/bin/tnslsnr ASMNET1LSNR_ASM -no_crs_notify -inherit
oracle   28900     1  0 11:55 ?        00:00:08 /u01/64bit/app/19.3.0/grid/bin/oraagent.bin
root     29849 25142  0 11:56 ?        00:00:03 /u01/64bit/app/19.3.0/grid/perl/bin/perl /u01/64bit/app/19.3.0/grid/bin/diagsnap.pl start
从上面我们可以看到pid=28900的代理进程oraagent的user是oracle,这是因为我在安装这套 Oracle RAC 时,GI软件是用 grid 用户安装的,DB软件则是用 oracle 用户安装的。所以为了管理数据库,CRSD 生成的代理进程则是 oracle 所属的。
grid     24629     1  1 11:54 ?        00:00:13 /u01/64bit/app/19.3.0/grid/bin/oraagent.bin
grid     27514     1  2 11:55 ?        00:00:26 /u01/64bit/app/19.3.0/grid/bin/oraagent.bin
oracle   28900     1  0 11:55 ?        00:00:08 /u01/64bit/app/19.3.0/grid/bin/oraagent.bin
root     24452     1  0 11:54 ?        00:02:06 /u01/64bit/app/19.3.0/grid/bin/orarootagent.bin
root     26857     1  1 11:55 ?        00:04:38 /u01/64bit/app/19.3.0/grid/bin/orarootagent.bin
而pid=24629和27514的代理进程oraagent的user则是grid。pid=24452和26857的代理进程orarootagent的user也都是grid。怎么会出现同名的代理进程呢?我们返回到上图可以看到,OHASD 和 CRSD 都生成了叫 oraagent 和orarootagent的代理进程。
通常情况下,我们不需要去区分这些代理进程的pid。因为我们在调查问题时只要看这些代理进程的追踪日志就可以了。而这些代理进程的追踪日志文件名都有前置名。是很容易区分开要查看的代理进程的日志。
/u01/64bit/app/grid/diag/crs/node1/crs/trace/crsd_oraagent_grid.trc
/u01/64bit/app/grid/diag/crs/node1/crs/trace/ohasd_oraagent_grid.trc
/u01/64bit/app/grid/diag/crs/node1/crs/trace/crsd_orarootagent_root.trc
/u01/64bit/app/grid/diag/crs/node1/crs/trace/ohasd_orarootagent_root.trc
但是当需要手动去kill掉代理进程时,找到要kill的对象则是必须的。这时候我们该如何确认哪一个是OHASD的代理进程,哪一个是CRSD的代理进程呢?
其实我们可以根据集群的告警日志来进行判断。下面是集群启动时告警日志输出的内容摘要。
2021-03-19 11:54:04.297 [OHASD(24048)]CRS-1301: Oracle High Availability Service started on node node1.
...
2021-03-19 11:54:09.525 [ORAROOTAGENT(24452)]CRS-8500: Oracle Clusterware ORAROOTAGENT process is starting with operating system process ID 24452
2021-03-19 11:54:12.075 [ORAAGENT(24629)]CRS-8500: Oracle Clusterware ORAAGENT process is starting with operating system process ID 24629
...
2021-03-19 11:55:01.612 [CRSD(26294)]CRS-1201: CRSD started on node node1.
...
2021-03-19 11:55:04.324 [ORAROOTAGENT(26857)]CRS-8500: Oracle Clusterware ORAROOTAGENT process is starting with operating system process ID 26857
2021-03-19 11:55:19.113 [ORAAGENT(27514)]CRS-8500: Oracle Clusterware ORAAGENT process is starting with operating system process ID 27514
在CRS-1301后面输出的是pid=24452的orarootagent和pid=24629的oraagent进程。所以我们可以判定是OHASD启动的代理进程。
在CRS-1201后面输出的是pid=26857的orarootagent和pid=27514的oraagent进程。所以我们可以判定这是由CRSD启动的代理进程。
另外从OS的角度我们也有个更不错的方法去区分这些代理进程是由谁启动的。
cat /proc/进程号/environ | tr "\000" "\n" | grep __CLSAGENT_LOGDIR_NAME
比如
[root@node1 ~]# cat /proc/24629/environ | tr "\000" "\n" | grep __CLSAGENT_LOGDIR_NAME
__CLSAGENT_LOGDIR_NAME=ohasd

[root@node1 ~]# cat /proc/27514/environ | tr "\000" "\n" | grep __CLSAGENT_LOGDIR_NAME
__CLSAGENT_LOGDIR_NAME=crsd
以上提到的不管是GI的启动还是GI相关的进程,其实都是试图帮助大家去了解最初抛出来的GI基本架构图
只要我们对上面的GI基本构架图有了相对清晰的认识,那么对于以后我们去研究GI的问题都是非常有帮助的。可以说上面的那张图是研究GI问题的基础。
4.GI的日志简介
我们在上面突然提到了代理进程的追踪日志和GI的告警日志。显得有些突兀。作为补充,我这里简单的介绍一些GI的日志体系。可以说研究GI问题,任何脱离了日志的研究和分析都是耍流氓。
GI的日志体系在12.2有一次很大的变动。因为18c之前的版本已经过了Premier Support。所以我这里只介绍12.2以后的日志体系。
GI的绝大部分日志都保存在以下路径下:
<Grid_Base>/diag/crs/<hostname>/crs/trace/
其中告警日志是GI的一个综合性输出日志。GI组件中任何重大信息都会输出到这个日志中。其性质有点类似于数据库的告警日志。然后GI的各个组件以及代理进程也都有自己的追踪日志。
当我们在调查问题时,往往需要将资源或者组件的日志以及相关的代理进程日志等仔细查看。因为这些组件和代理进程以及资源都不是独立存在的,我们需要从中追查到内在的动作关系。
另外这些日志都有自己的rotation机制。如果以后有时间,我会专门写个专题来介绍GI的日志体系,在这里我就不再做继续的展开了。
GI架构确实比较繁杂,刚入门的小同学可能往往一头雾水。我试图以自己的角度去帮助大家概要性的了解它,如果大家有什么问题,都可以给我留言。
时间已晚,先写到这里,晚安!
发布者:全栈程序员-用户IM,转载请注明出处:https://javaforall.cn/183297.html原文链接:https://javaforall.cn
【正版授权,激活自己账号】: Jetbrains全家桶Ide使用,1年售后保障,每天仅需1毛
【官方授权 正版激活】: 官方授权 正版激活 支持Jetbrains家族下所有IDE 使用个人JB账号...
