大家好,又见面了,我是你们的朋友全栈君。
1 函数命令拟合
最常用的函数拟合命令为fit,语法为|
[拟合结果 拟合精度]=fit(X数据,Y数据,‘拟合类型’)
其中,具体的拟合类型可以参看帮助文档,也可以使用fittype来自定义新的函数类型,比如定义拟合函数a*x+b*x^2+exp(4*x);|
newtype=fittype('a*x+b*x^2+exp(4*x)') ;
fit(x,y,newtype);

x=[1;2;3;4;5];
y=[2;3;4;5;6];
2 使用界面启动拟合工具箱


具体操作步骤
- 在APP一栏,选择
curve fitting工具箱,然后选择相应阶段的数据,填入X data和Y data - 在
fit options一栏选择对应的函数形式,阶数,和鲁棒性 - 点击工具栏的
residuals plot,便于观察拟合误差 - 点击工具栏的
data cursor,可以用鼠标在曲线上标记出具体的坐标值
3 界面介绍
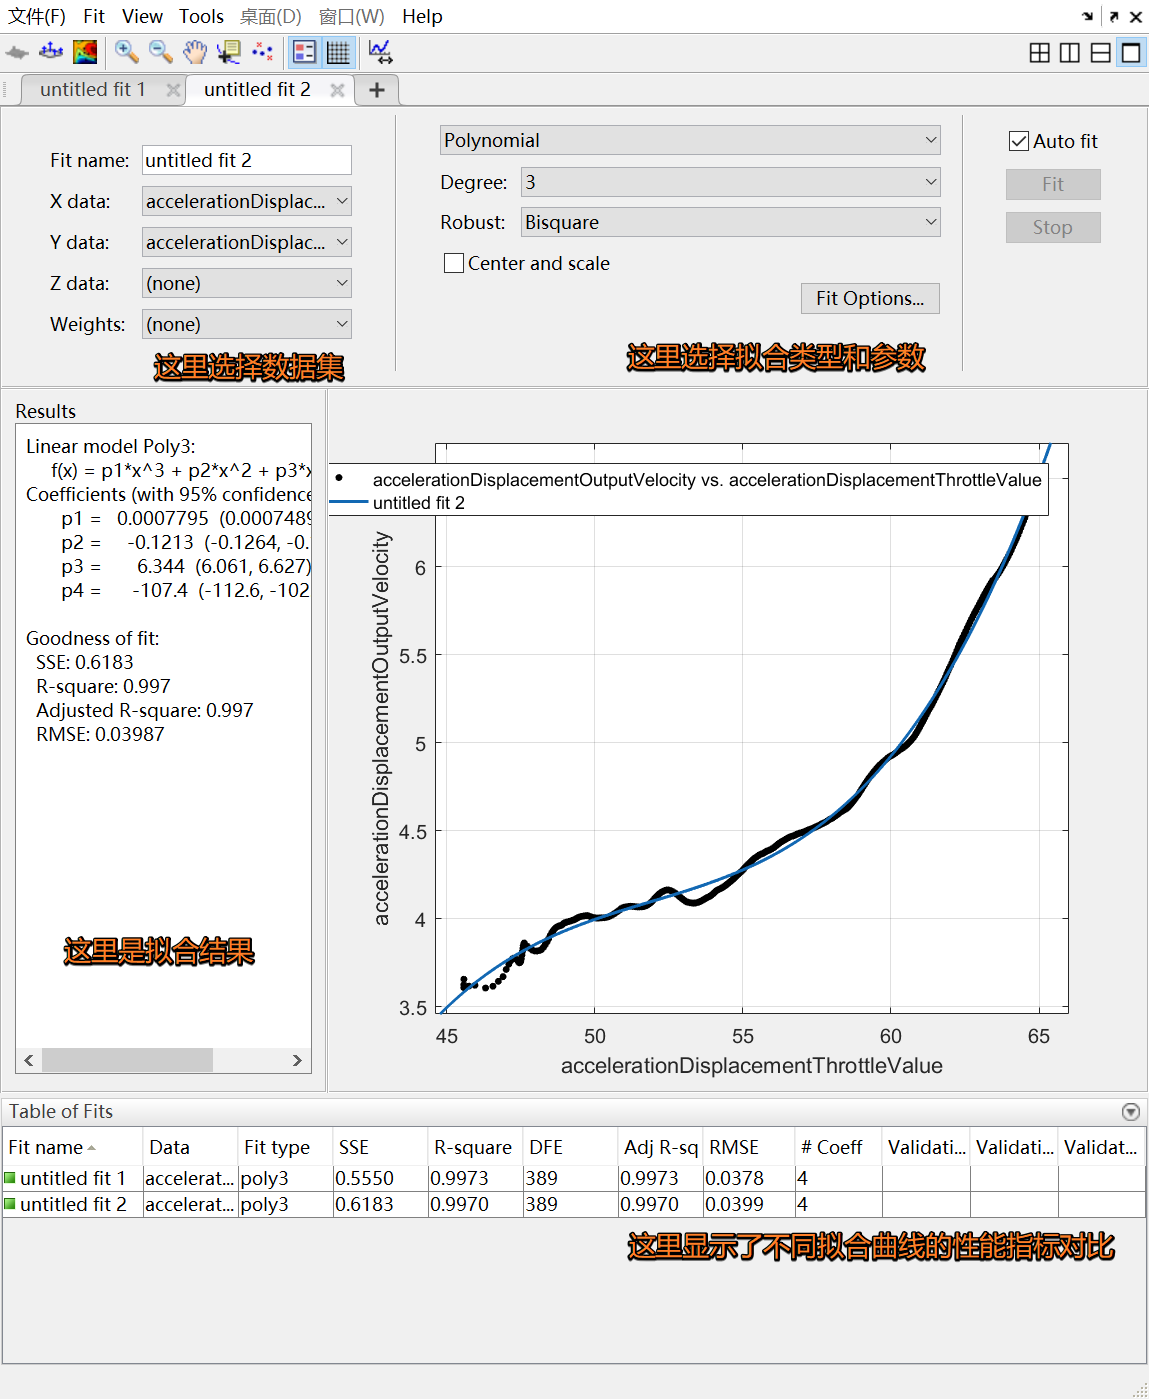
- 顶部为常用工具栏,常用的一般有误差分析和鼠标标记坐标点
Fit Options可以选择拟合类型和函数次数- 左侧Results显示了拟合结果的性能参数
- 底部的
table of fits可以对多个不同的拟合结果进行性能比较
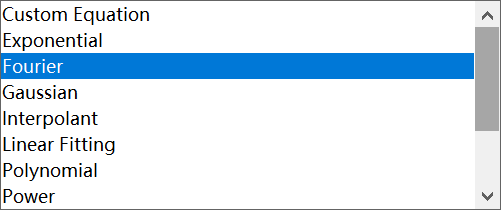
4 拟合类型
| 拟合类型 | 解释 |
|---|---|
| Custom Equations | 用户自定义的函数类型 |
| Exponential | exp指数逼近,有2种类型, a*exp(b*x)、 a*exp(b*x) + c*exp(d*x) |
| Fourier | 傅立叶逼近,有7种类型,基础型是 a0 + a1*cos(x*w) + b1*sin(x*w) |
| Gaussian | 高斯逼近,有8种类型,基础型是 a1*exp(-((x-b1)/c1)^2) |
| Interpolant | 插值逼近,有4种类型,linear、nearest neighbor、cubic spline、shape-preserving |
| Polynomial | 多形式逼近,有9种类型,linear ~、quadratic ~、cubic ~、4-9th degree ~ |
| Power | 幂逼近,有2种类型,a*x^b 、a*x^b + c |
| Rational | 有理数逼近,分子、分母共有的类型是linear ~、quadratic ~、cubic ~、4-5th degree ~;此外,分子还包括constant型 |
| Smoothing Spline | 平滑逼近 |
| Sum of Sin Functions | 正弦曲线逼近,有8种类型,基础型是 a1*sin(b1*x + c1) |
| Weibull | 只有一种,a*b*x^(b-1)*exp(-a*x^b) |
5 拟合结果说明
例如在上面的拟合中,选择Polynomial类型,Degree选择3阶,Robust选择Off,得到的Results如下:
Linear model Poly3:
     f(x) = p1*x^3 + p2*x^2 + p3*x + p4
Coefficients (with 95% confidence bounds):
       p1 =   0.0007776  (0.0007486, 0.0008066)
       p2 =      -0.121  (-0.1258, -0.1161)
       p3 =       6.324  (6.055, 6.592)
       p4 =        -107  (-111.9, -102)

Goodness of fit:
  SSE: 0.555
  R-square: 0.9973
  Adjusted R-square: 0.9973
  RMSE: 0.03777
其中,Goodness of fit里面的性能指标如图所示:
| 性能指标 | 解释 |
|---|---|
| SSE | The sum of squares due to error. This statistic measures the deviation of the responses from the fitted values of the responses. A value closer to 0 indicates a better fit. |
| R-square | The coefficient of multiple determination. This statistic measures how successful the fit is in explaining the variation of the data. A value closer to 1 indicates a better fit. |
| Adjusted R-square | The degree of freedom adjusted R-square. A value closer to 1 indicates a better fit. It is generally the best indicator of the fit quality when you add additional coefficients to your model. |
| RMSE | The root mean squared error. A value closer to 0 indicates a better fit. |
6 参考文献
- 函数拟合工具包 [Fudan Physics Teaching Lab]
http://phylab.fudan.edu.cn/doku.php?id=howtos:matlab:mt1-5 - Matlab的曲线拟合工具箱CFtool使用简介 – yousun – 博客园
https://www.cnblogs.com/yousun/p/3450676.html
版权声明:本文内容由互联网用户自发贡献,该文观点仅代表作者本人。本站仅提供信息存储空间服务,不拥有所有权,不承担相关法律责任。如发现本站有涉嫌侵权/违法违规的内容, 请发送邮件至 举报,一经查实,本站将立刻删除。
发布者:全栈程序员-用户IM,转载请注明出处:https://javaforall.cn/160795.html原文链接:https://javaforall.cn
【正版授权,激活自己账号】: Jetbrains全家桶Ide使用,1年售后保障,每天仅需1毛
【官方授权 正版激活】: 官方授权 正版激活 支持Jetbrains家族下所有IDE 使用个人JB账号...
