大家好,又见面了,我是你们的朋友全栈君。
本文持续更新…
目录
本文是笔者初学WinEdt用以编辑Latex的笔记,只涉及一些简单问题,详细请参考百度文库(点点这几个字看看~~)
本文的主要参考文献是ta
0 包文件
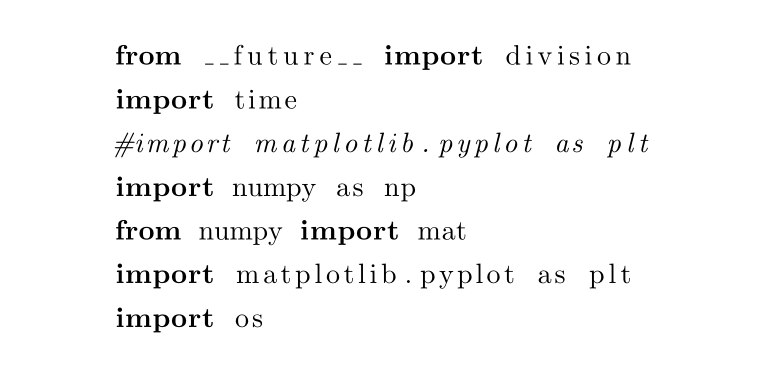
这里主要给出本文所有的头文件,即需要使用的包。在运行本文中的事例之前在开头复制以下代码
% !Mode::"TeX:UTF-8"
%\documentclass[prd,aps,onecolumn,preprintnumbers,amsmath,amssymb,superscriptaddress]{article}
\documentclass{article}
%\usepackage[UTF8]{ctex}
\usepackage{listings}
\usepackage{amsthm}
\usepackage{amsmath}
\usepackage{amssymb}
\usepackage{subfigure}
\usepackage{graphicx}
\usepackage{hyperref}
\usepackage[table]{xcolor}
\usepackage{fancyhdr}
\usepackage{footnote}
\usepackage{lastpage}
%\usepackage{pythonhighlight}
\usepackage{indentfirst}
\usepackage{multirow}
\usepackage{authblk}
\usepackage{comment}
\usepackage{url}
\usepackage{float}
\usepackage{cite}
\usepackage{caption}
%\usepackage{graphix}
\setlength{\parindent}{1em}
%\pagestyle{fancy}
%设置页面大小
%\chead{LSPE}
%\rhead{\thesection}
%\cfoot{Page \thepage of \pageref{LastPage}}
\usepackage[top=2.54cm, bottom=2.54cm, left=3.18cm,right=3.18cm]{geometry}
1.字体
1.1 字体大小
1 设置latex/winedt代码中字体大小
options—options interface—Font schemes—Font双击从右边找到FONT_SIZE将10改为自己想要的,如14—-保存—右键单击左边之前的Font—-Load Script—结束
2 设置文章字体大小
\tiny
\scriptsize
\footnotesize
\small
\normalsize
\large
\Large
\LARGE
\huge
\Huge
比如:
{\small Hello word}
花括号框住的地方都变小
1.2 字体加粗
文本加粗
\textbf{这里放文本}
既要加粗又要变小:(为毛感觉有点邪恶~~ 2333333 认真脸)
{\textbf{\small Hello word}}
数学符号加粗
$\boldsymbol 直接接数学符号 $
1.3 字体显示形式
1.3.1 删除字体
\usepackage{cancel}
\cancel{abc}


1.3.2 下标线
这里解决的问题是下标线导致的问题,如
f_x
结果为: f x f_x fx
而我想要的结果是下划线一起输出,我们需要一个转义字符\即可,
f\_x
f _ x f\_x f_x
1.3.3 其他形式
\cancel{abe}
\textbar{abc}
\textcircled{acbd}
更多形式可以在\text…自动补全查看

2.分段机制
1, 在原码中空一行,则生成的pdf会换行
2, 在文后使用双斜杠\
3, 使用命令
\newparas
举例:
Life is too short so that I use python\\
me too.

Life is too short so that I use python

me too.

Life is too short so that I use python
\newparas
me too.

3.空格
参考自:seaskying
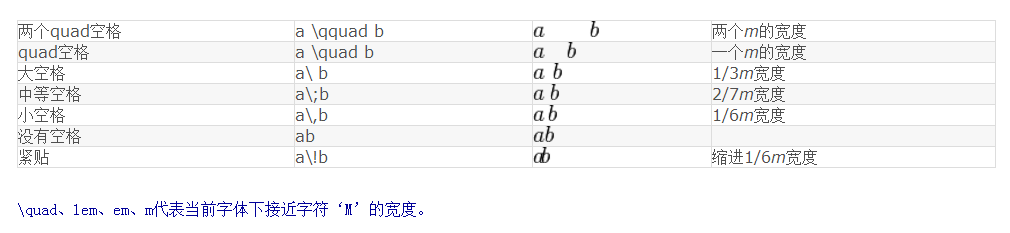
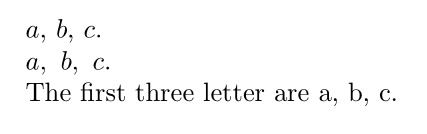
当然直接空一格也是可以得到一个空格的,如下:
  $a$, $b$, $c$.

  $a,\ b,\ c.$

  The first three letter are a, b, c.
结果为:
所以如果要空格直接按空格键即可,即上面代码的1和3方式
4.自动补全
快捷键:Ctrl+Enter
5.数学模式与文本模式
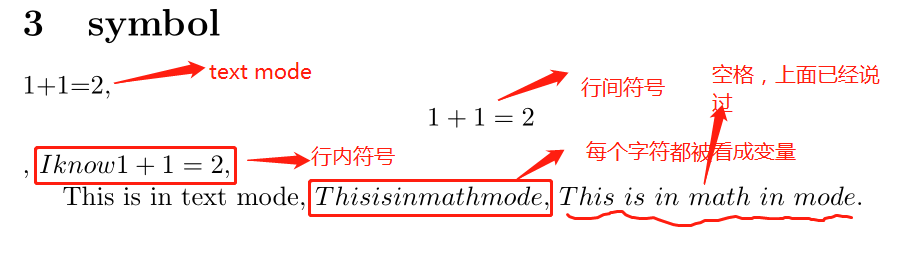
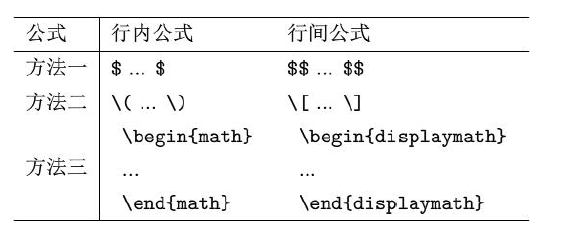
5.1 行内公式和行间公式
引入数学宏包{amssyb},American mathematics society symbol.例句如下
% !Mode::"TeX:UTF-8"
\documentclass{article}
\usepackage{amssymb}
\begin{document}
  \section{symbol}
  1+1=2, $$1+1=2$$, $I know 1+1=2,$

  This is in text mode, $This is in math mode,$ $This\ is\ in\ math\ in\ mode.$

\end{document}
结果如下:
对行内公式和行间公式总结如下:
上面的方法是无法给公式编号的
5.2 数学公式编号
手动编号
通过采用\tag来编号,当引用公式时手动输入。缺点是当更改公式里的编号时引用中的编号不能自动更改,其二,不同通过点击引用的编号回到公式
$$y=1+e^x \tag{1.1}$$
我们今天要讨论这个方程$(1.1)$
y = 1 + e x (1.1) y=1+e^x \tag{1.1} y=1+ex(1.1)
我们今天要讨论这个方程 ( 1.1 ) (1.1) (1.1)
这个好处是在处理文章比较长,有很多节,如写书等时,可以手动写(1.1),(2.1)(2.1.1)等公式,而自动则是(1)(2)这样排序,没有分小节。
自动编号
建立公式环境,如下:
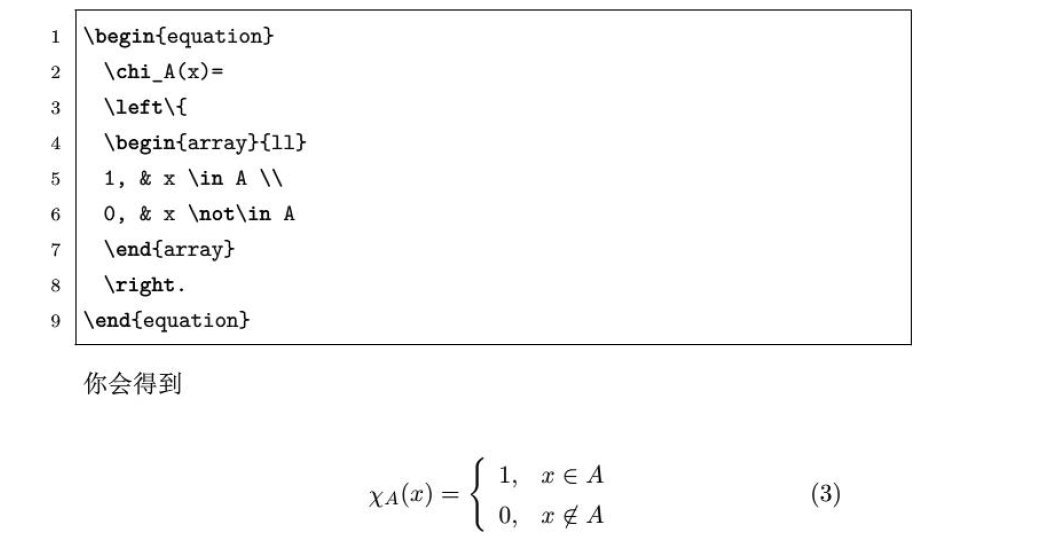
\begin{equation}\label{加入标记}
xxx
\end{equation}
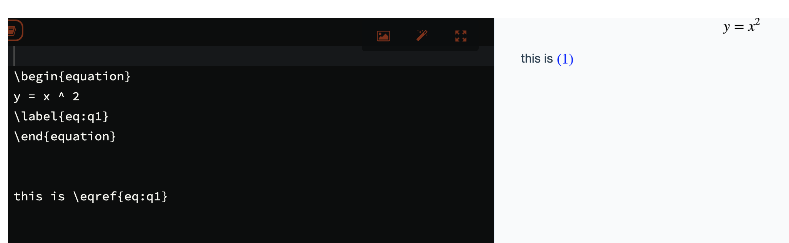
不同的平台渲染不一样,比如为知笔记, latex等可以通过以下方法渲染自动编号
为知笔记
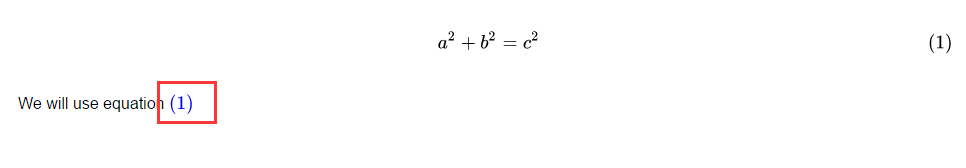
$$\begin{equation}\label{my_equ1}
a^2+b^2=c^2
\end{equation}$$
We will use equation \eqref{my_equ1}

Latex
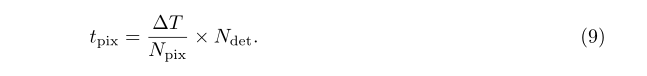
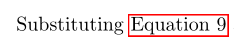
对于latex而言,不需要$$这样的符号
\begin{equation}\label{time_pixel}
  t_\text{pix}=\frac{\Delta T}{N_\text{pix}}\times N_\text{det}.
\end{equation}

Substituting \autoref{time_pixel}
马克飞象
(马克飞象有时候渲染会失败,跟官方人员问过,给的办法是:失败的时候重新打开就可以看到自动编号,但是遗憾的是,当你尝试改动时又会出错,因此官方建议先编写完,再渲染,这样就不会去动它了。。。。呵呵哒。)
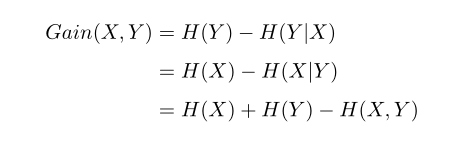
5.3 数学公式对齐
采用{aligned}如下:
\begin{equation}\label{information gain}
\begin{aligned}
  Gain(X,Y)&=H(Y)-H(Y|X)\\
  &=H(X)-H(X|Y)\\
  &=H(X)+H(Y)-H(X,Y)
\end{aligned}
\end{equation}
结果为:
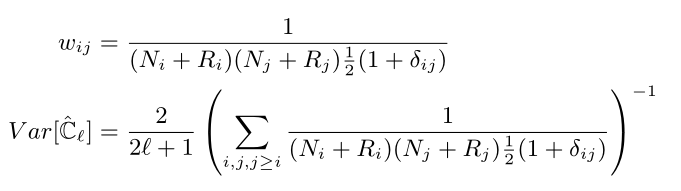
\begin{equation}\label{lagrangian}
\begin{aligned}
  w_{ij}&=\frac{1}{(N_i+R_i)(N_j+R_j)\frac{1}{2}(1+\delta_{ij})}\\
  Var[\mathbb{\hat{C}}_\ell]&=\frac{2}{2\ell+1}\left(\sum_{i,j,j\ge i}\frac{1}{(N_i+R_i)(N_j+R_j)\frac{1}{2}(1+\delta_{ij})}\right)^{-1}
\end{aligned}
\end{equation}
更新
对上面的多行对其进行更新补充(2021.3.24)
上面的多行对齐使用的是aligned不是align或者align*,后者会存在一定问题,即equation已经开启了一个数学模式,align又开启一个,这将会导致数学模式的嵌套,但aligned是没问题的。
现在将equation和align分开,使用的包是amsmath
\usepackage{
   amsmath}
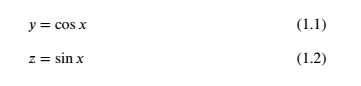
1)对齐且每个公式后都有编号
\begin{
   align}
y&=\cos x\\
z&=\sin x
\end{
   align}
2)对齐但没有编号,对align加一个星号即可
\begin{
   align*}
y&=\cos x\\
z&=\sin x
\end{
   align*}

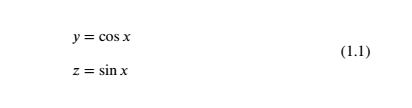
3)对齐只有一个编号
使用split将公式分行,并会在中间位置编号。
\begin{
   equation}
\begin{
   split}
y&=\cos x\\
z&=\sin x
\end{
   split}
\end{
   equation}
为知笔记的对齐
跟上面一样,但是为知笔记这样的缺点是,不能再使用\eqref{label}的方法引用了,所以也是一大缺点
\begin{equation}\label{cos_age}
\begin{aligned}
t_0&=\int \ dt\\\
&=\frac{1}{H_0}\int_{0}^{1}\frac{da}{a\sqrt{\Omega_{\Lambda0}+\Omega_{k0}(a_0/a)^2+\Omega_{m0}(a_0/a)^3+\Omega_{r0}(a_0/a)^4}}
\end{aligned}
\end{equation}
5.4 公式之间空格
没有空格
\begin{equation}\label{add_prior}
  \frac{\sigma(A_s^p)}{A_s^p}=0.17, \sigma(\beta_s)=0.17, \frac{\sigma(A_d^p)}{A_d^p}=0.015, \sigma(\beta_d)=0.02
\end{equation}
发现上面的公式之间挨得太近了,想要空格,可以使用第3部分提到的空格方法,将上面的代码增加\quad:
\begin{equation}\label{add_prior}
  \frac{\sigma(A_s^p)}{A_s^p}=0.17,\quad \sigma(\beta_s)=0.17,\quad \frac{\sigma(A_d^p)}{A_d^p}=0.015,\quad \sigma(\beta_d)=0.02
\end{equation}
6.输入函数
输入函数前面加斜杠””
如:
$\frac{10}{11}, \sqrt[3]{x^2+1}, \ldots, \sin x, \cos x.$
结果如下:
可以看到,虽然在上面代码每个逗号之后都输入了空格,但得到的pdf文档并没有逗号,而英文中是习惯在逗号,句号等符号之后加空格的,这个时候可以将上面代码改为:
$\frac{10}{11},$ $\sqrt[3]{x^2+1},$ $\ldots,$ $\sin x,$ $\cos x.$
即每个函数单独用美元符号分开,并在两者之间加符号。
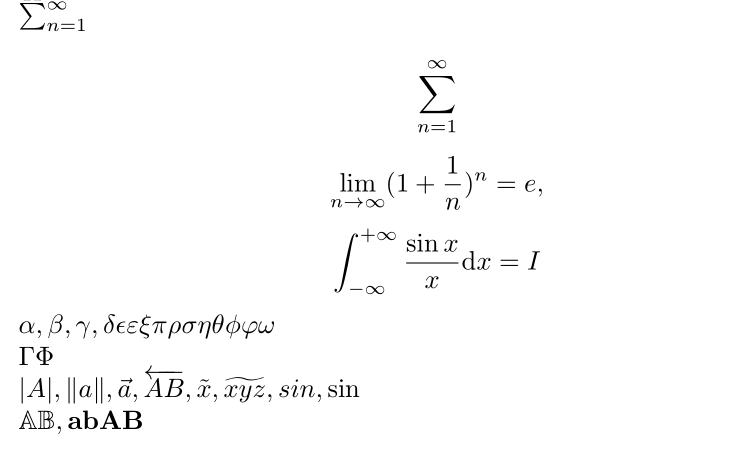
  $\sum_{n=1}^{\infty}$

  $$\sum_{n=1}^{\infty}$$

  $$\lim_{n \to \infty}(1+\frac{1}{n})^n = e,$$
  $$\int_{-\infty}^{+\infty}\frac{\sin x}{x} \mathrm{d}x=I$$

  $\alpha,\beta,\gamma,\delta\epsilon\varepsilon\xi\pi\rho\sigma\eta\theta\phi\varphi\omega$

  $\Gamma\Phi$

  $|A|,\|a\|,\vec{a},\overleftarrow{AB},\tilde{x},\widetilde{xyz},sin,\mathrm{sin}$

  $\mathbb{AB},\mathbf{abAB}$
(1)第一行是行内公式和第二行的行间公式是不一样的,这是出于文本美观的目的。
(2)\mathrm{d}那儿是为了和x不同,因为d是直立的而不是变量,而x是变量,这里mathrm=math roman
(3)剩下的看到gamma等希腊字母第一个字母大写则表示输出的文本是大写,这里值得注意的是:alpha,beta,varepsilon等是没有大写形式的,因为其大写形式就是ABE,不能输入\Alpha,\Beta…
(4)mathbb=math blackboard, mathbf=math boldface
实际上第行中的括号应该是大括号而不是小括号,细节见下节。
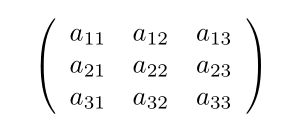
7.矩阵和大括号
先看矩阵
  \begin{equation}
    \left(
    \begin{array}{ccc}
    a_{11}& a_{12} & a_{13} \\
    a_{21} & a_{22} & a_{23} \\
    a_{31} & a_{32} & a_{33}
    \end{array}
    \right)
  \end{equation}
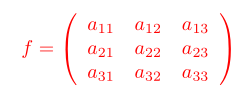
如果需要写 “函数=矩阵” 的形式,只需要在\left前加入即可,如:
\begin{equation}
    f=
    \left(
    \begin{array}{ccc}
    a_{11}& a_{12} & a_{13} \\
    a_{21} & a_{22} & a_{23} \\
    a_{31} & a_{32} & a_{33}
    \end{array}
    \right)
\end{equation}
(这里不要纠结颜色,因为我都改为红色了)
(1)以上begin{equation}开始了一个公式环境,在这个环境中可以直接输入变量、函数等而不需要加$符号,上面等同于
   $$ \left(
    \begin{array}{ccc}
    a_{11}& a_{12} & a_{13} \\
    a_{21} & a_{22} & a_{23} \\
    a_{31} & a_{32} & a_{33}
    \end{array}
    \right)$$
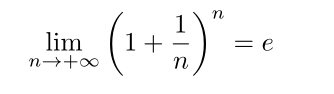
(2)\left( and \right) are left bracket and right bracket. 能够通过括号内的内容自动改变括号大小。所以上面6中的第三行应该改为:
$$\lim_{n \to +\infty}\left(1+\frac{1}{n}\right)^n=e$$
(3)符号&是用来分隔列的,同一行不同列之间的元素用&分隔开
(4){ccc}是array中必选参数,为center,center,center,表示三列都居中,
(5)\是强制换行符号
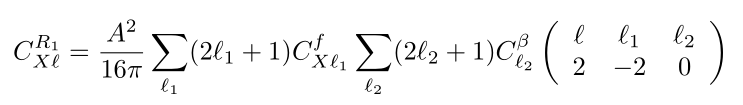
\begin{equation}\label{Cx1}
  C_{X\ell}^{R_1}=\frac{A^2}{16\pi}\sum_{\ell_1}(2\ell_1+1)C_{X\ell_1}^f\sum_{\ell_2}(2\ell_2+1)C_{\ell_2}^\beta\left(
  \begin{array}{ccc}
  \ell&\ell_1&\ell_2\\
  2&-2&0
  \end{array}
  \right)
\end{equation}
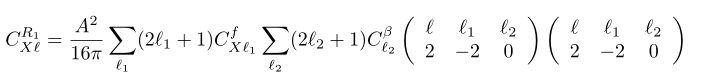
\begin{equation}\label{Cx1}
  C_{X\ell}^{R_1}=\frac{A^2}{16\pi}\sum_{\ell_1}(2\ell_1+1)C_{X\ell_1}^f\sum_{\ell_2}(2\ell_2+1)C_{\ell_2}^\beta\left(
  \begin{array}{ccc}
  \ell&\ell_1&\ell_2\\
  2&-2&0
  \end{array}
  \right)
\left(
\begin{array}{ccc}
\ell&\ell_1&\ell_2\\
2&-2&0
\end{array}
\right)
\end{equation}
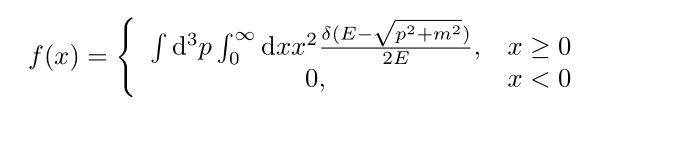
8.分段函数
分段函数是在矩阵的基础之上的,比如如下的分段函数
  \begin{equation}
    f(x)=
    \left\{
    \begin{array}{cc}
    \int \mathrm{d}^3p\int_{0}^{\infty}\mathrm{d}x x^2 \frac{\delta(E-\sqrt{p^2+m^2})}{2E} , & x \geq 0 \\
    0,& x < 0
    \end{array}
    \right.
  \end{equation}
(1)不需要右括号
(2)&的作用是使得列对齐
9.加载宏包doc文档
当我们使用一个宏包比如amsmath,想要得到说明文时可以如下操作:
在控制台上点击终端cmd窗口,输入tex xxx(xxx是宏包名,如amsmath)回车即可。
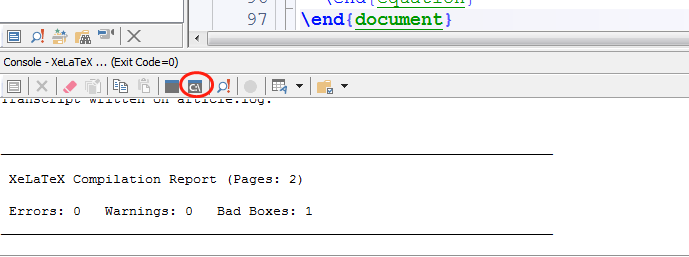
终端按钮如下图:
10.输入中文以及宏包安装
输入中文需要用到ctex包,这是专门针对中文而设计的包,使用时在前面将
\document{article}
改为
\document[UTF8]{ctexart}
即可,(有的不需要加方括号中的内容),或者\document{article}不变,在其下加入一个宏包为
\usepackage[UTF8]{ctex}
此外,中文包还可以使用
\usepackage{CJK}
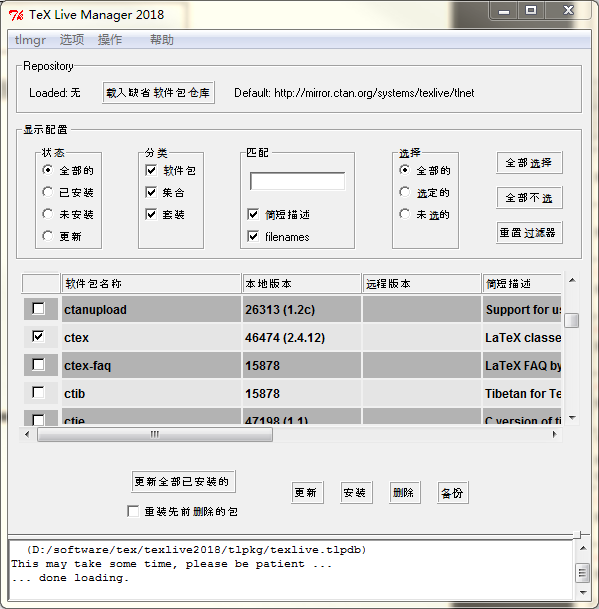
当然,前提是已经安装ctex宏包,通常情况都会自动安装好,如果没有安装可以如下(笔者用的是Tex live)
开始—tex live—tex live manager—找到ctex—点击安装
值得注意的是:宏包已经都不需要网上下载安装,而是直接从库上安装缺少的宏包,方法就是上面的方法。
11.插入图片
插入图片可以引用命令:
\ref{fig} or \autoref{fig}
前者只给图片序号,而后者为Figure + 序号
插入图片需要加载宏包
\usepackage{graphicx}
或
\usepackage{graphics}
建议前者。
插入图片的环境为:
  \begin{figure}[ht]
    \centering
    \includegraphics[width=10cm]{hh}
     \caption{这个是图片}\label{bbb}
  \end{figure}
解释:
(1)第一句begin{figure}代表开始插入图片,后面的[ht]是可选参数,表示here, top。如果去掉[ht]表示默认的htbp,分别表示“这里,顶部,底部,换一页”(here, top, bottom, page)
(2)第二句是图片居中,否则自动靠左
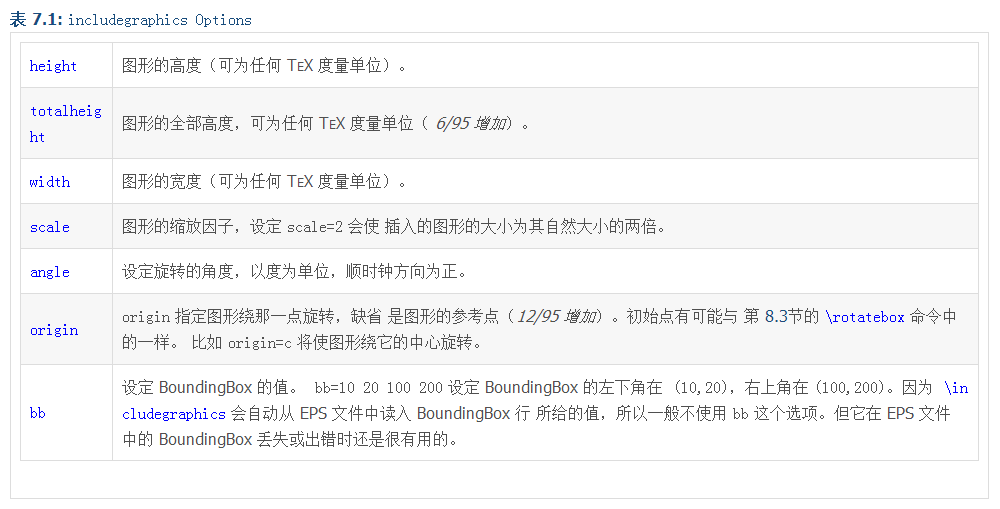
(3)[width=10cm] (有些people不需要加cm,是已经设置单位是cm了,还可以有in英尺),可选的参数还有如下(可参考DreamSeeking的文献):
第三行最后的{hh}表示插入的图片的名字,因此插入的图片一定要放在工作目录下,并命名为hh.xxx(xxx表示后缀,如png,jpg,eps等)
当然也有不在工作目录下的方法,这个google一下by yourself.在此不累赘。(好吧,让我再告诉你好了,其实就是使用绝对路径
\includegraphics[width=10cm]{D:/software/tex/hh.png}
当然,.png后缀可以不写)注意,绝对路径中是用的左斜杠“/”而不是右斜杠。
此外如果图片比较多,最好的方法是在当前工作路径下单独建一个文件夹,命名为fig.然后将图片都放进去,此后要使用里面的图片时只需要使用路径加载即可,这是相对路径方法,如下:
\includegraphics[width=10cm]{fig/hh}
(4)caption{这个是图片}表示对图片的描述,将出现在图片的底下。label{bbb}表示对这张图片的标签,相当于给定了这张图片的名字。图片较多时,建议使用容易看懂的名字,如label{fig.sub.1}。这个label的作用是方便以后引用这个图时只需要用其标签就可以,比如
see,figure\ref{fig.sub.1} or \autoref{fig.sub.1}
结果就是:see,figure x(x表示刚刚插入的图的序号,如图3)
(5)这样插入的图片是一个浮动图,也就是latex自动找到最好的位置来放置此图,而不是你代码设置的地方,想要得到不浮动的图可以将
\includegraphics[width=10cm]{fig/hh}
这句单独提取出来放置想要放的代码中即可,但这个时候是不能加
\caption{xxx}
这一句的,也就是没法加入标题。如果要给不浮动的图形加标题,那么可以看看nonfloat 包或者自己google(这回是朕是真的不打算给你找了)。
12.表格
12.1普通表格
表格制作可以参考这个 and 这个(点一下试试),后者是英文。
简单说明:
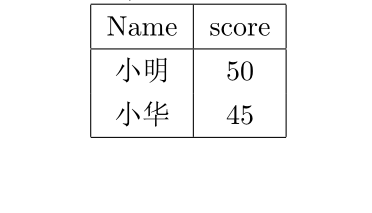
表格制作可以使用tabular,简单一个图如下:
  \begin{tabular}{|c|c|}
    \hline
    % after \\: \hline or \cline{col1-col2} \cline{col3-col4} ...
    Name & score \\
    \hline
    小明 & 50 \\
    小华 & 45 \\
    \hline
  \end{tabular}
结果如下
讲解:
(1)第一句是tabular表格的开始,参数{|c|c|}中的第一个|表示表格中的左边竖,第二、三个分别是中间和右边的竖。而c表示表格中的字体居中,l(left)和r(right)表示表格中字体靠左和靠右。可以尝试将{|c|c|}改为{c|c}即不要两边的竖线。
(2)\hline(horizontal line)表示画一条水平线
(3)%是注释,\是换行,\hline可以紧接在\后,如下表示:
\\ \hline
会显得更紧凑。
当然,这个表格是不浮动的,和图片一样,如果想加入\caption的话,可以构成浮动的图片(但毕竟可以写标题了呀,想想还是赚的)。这个时候需要用到table环境。如下
  \begin{table}
  \centering
  \begin{tabular}{|c|c|}
    \hline
    % after \\: \hline or \cline{col1-col2} \cline{col3-col4} ...
    Name & score \\
    \hline
    小明 & 50 \\
    小华 & 45 \\
    \hline
  \end{tabular}
    \caption{这是一个表格}
  \end{table}
同样的\centering是表格居中,否则居左。其他都讲过了,很easy.最后可以使用caption宏包,这个需要自行google。
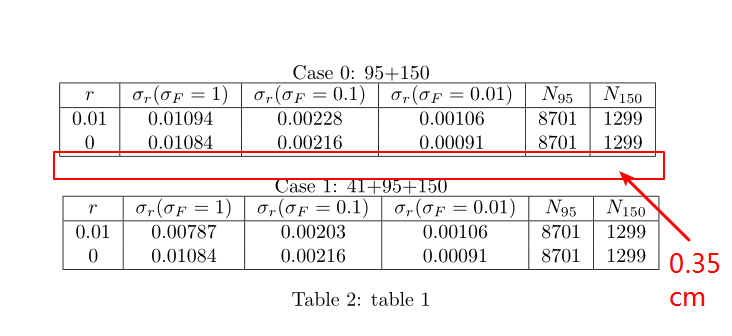
在表格中换行
比如两个表格(table)是要构成一个table的,想统一做一个说明,而不是每个table单独说明,此时需要将两个表格分开,这个时候可以用命令:
\vspace{0.35cm} #表示上下空0.35cm的空间
比如
\begin{table}
  \centering
  %\footnotesize
  Case 0: 95+150

  \begin{tabular}{|c|c|c|c|c|c|}
  \hline
  $r$ & $\sigma_r(\sigma_F=1)$ & $\sigma_r(\sigma_F=0.1)$ & $\sigma_r(\sigma_F=0.01)$ & $N_{95}$ & $N_{150}$\\
  \hline
  0.01 & 0.01094 & 0.00228 & 0.00106 & 8701 & 1299 \\
  0 & 0.01084 & 0.00216 & 0.00091 & 8701 & 1299 \\
  \hline
  \end{tabular}
  \vspace{0.35cm}    #空0.35cm

 Case 1: 41+95+150

  \begin{tabular}{|c|c|c|c|c|c|}
  \hline
  $r$ & $\sigma_r(\sigma_F=1)$ & $\sigma_r(\sigma_F=0.1)$ & $\sigma_r(\sigma_F=0.01)$ & $N_{95}$ & $N_{150}$\\
  \hline
  0.01 & 0.00787 & 0.00203 & 0.00106 & 8701 & 1299 \\
  0 & 0.01084 & 0.00216 & 0.00091 & 8701 & 1299 \\
  \hline
  \end{tabular}
  \caption{table 1}\label{anser1}
\end{table}
如果要改变字体大小,只要在第二行即\centering下加入改变字体大小的代码即可,(如我已经注释掉的\footnotesize),更多字体大小的代码见第一部分。
调整表格和标题/标注的距离
可以使用以下两个命令,关于调节距离多少,可以尝试调节里面的数字
\setlength{\abovecaptionskip}{0.cm}

\setlength{\belowcaptionskip}{-0.9cm}
多行
现在要将上面的tabe2设置为如下形式,即对应r=0.01有多个 σ F \sigma_F σF可选。
代码如下:
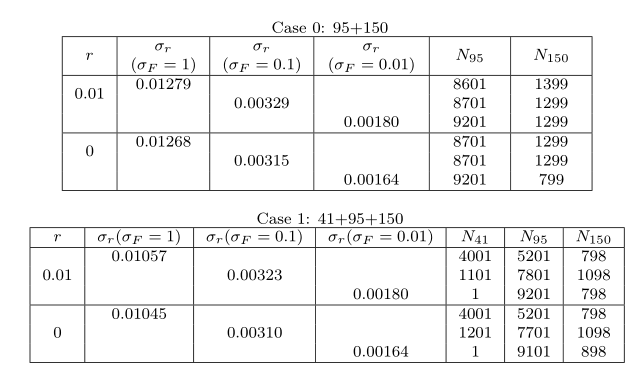
\begin{table}
  \centering
  \footnotesize
  Case 0: 95+150

  \begin{tabular}{|c|c|c|c|c|c|c|}
  \hline
  \multirow{2}{0.25cm}{\centering $r$} & \multirow{2}{1.2cm}{\centering $\sigma_r$\\$(\sigma_F=1)$} & \multirow{2}{1.4cm}{\centering $\sigma_r$\\$(\sigma_F=0.1)$} & \multirow{2}{1.6cm}{\centering $\sigma_r$\\$(\sigma_F=0.01)$} & \multirow{2}{1cm}{\centering $N_{95}$} & \multirow{2}{1cm}{\centering $N_{150}$}\\
  & & & & & \\
  \hline
  \multirow{2}*{0.01} & 0.01279 & & & 8601 & 1399 \\
    & & 0.00329 & & 8701 & 1299 \\
    & & & 0.00180 & 9201 & 1299 \\
  \hline
  \multirow{2}*{0} & 0.01268 & & & 8701 & 1299 \\
   & & 0.00315 & &8701 & 1299\\
   & & & 0.00164 & 9201 & 799 \\
   \hline
  \end{tabular}
  \vspace{0.35cm}

  Case 1: 41+95+150

  \begin{tabular}{|c|c|c|c|c|c|c|}
  \hline
  $r$ & $\sigma_r(\sigma_F=1)$ & $\sigma_r(\sigma_F=0.1)$ & $\sigma_r(\sigma_F=0.01)$ & $N_{41}$ & $N_{95}$ & $N_{150}$\\
  \hline
   & 0.01057 &  &  & 4001 & 5201 & 798 \\
  0.01 &  & 0.00323 & & 1101 & 7801 & 1098 \\
   & & & 0.00180 & 1 & 9201 & 798 \\
  \hline
   & 0.01045 & & & 4001 & 5201 & 798 \\
   0 & & 0.00310 & & 1201 & 7701 & 1098 \\
    & & & 0.00164 & 1 & 9101 & 898 \\
  \hline
  \end{tabular}
  \caption{table 1}\label{anser1}
\end{table}
12.2合并行列
1,合并行
使用
\multirow{n}*{text} #n表示要合并的行数,*是必须的,否则无法编译成功,text是此行中要输入的内容
注意,使用\multirow一定要在导言区,也就是在最开头使用包\usepackage{multirow}
举例如下:
% !Mode::"TeX:UTF-8"
\documentclass{article}
\usepackage[UTF8]{ctex}
\usepackage{listings}
\usepackage{amsthm}
\usepackage{amsmath}
\usepackage{amssymb}
\usepackage{graphicx}
\usepackage{hyperref}
\usepackage[table]{xcolor}
\usepackage{fancyhdr}
\usepackage{lastpage}
\usepackage{pythonhighlight}
\pagestyle{fancy}
\usepackage{enumitem}
\setlist[trivlist]{topsep=\baselineskip}
\usepackage{multirow}

%这里以上都是导言区

\begin{document}
\begin{tabular}{|c|c|c|}
  \hline
  \multirow{3}*{朕} & 尚书省 & 工部  刑部  兵部  礼部  户部  吏部 \\
  \cline{2-3}
    & 中书省 & ... \\
  \cline{2-3}
    & 门下省 & ... \\
  \hline
\end{tabular}
\end{document}
得到如下图:
上面中 \cline{a-b}表示从第a列画一条到第b列的线,与\hline的区别在于可以指定线的起始位置。

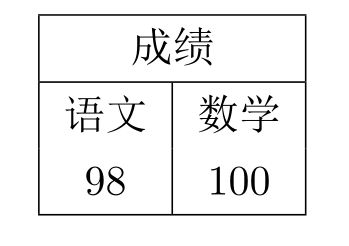
2,合并列
使用
\multicolumn{n}{x}{text} #n为合并列的数量,x为字体的排版样式,比如r,l,c分别表示右对齐,左对齐,居中,text为内容
例子
\begin{document}
\begin{tabular}{|c|c|}
  \hline
  \multicolumn{2}{|c|}{成绩} \\
  \hline
  语文 & 数学 \\
  98 & 100 \\
  \hline
\end{tabular}
\end{document}
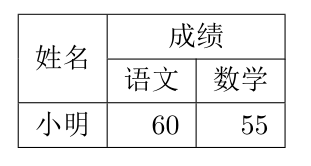
3,行列都存在
\begin{document}
\begin{tabular}{|c|r|r|}
\hline
\multirow{2}*{姓名} & \multicolumn{2}{c|}{成绩}  \\
\cline{2-3}
  & 语文 & 数学 \\
\hline
 小明 & 60 &  55 \\
\hline
\end{tabular}
\end{document}
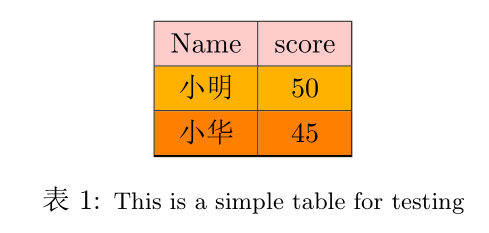
12.3表格下标注释和字体大小设置
给定一个表格后,表下可能会有表格的介绍,而介绍的字体通常比文章字体小,可以用
\small{}
  \begin{table}
  \centering
  \rowcolors[\hline]{2}{orange}{red!30!yellow}
  \begin{tabular}{|c|c|}
    \rowcolor{red!20}
    Name & score \\
    小明 & 50 \\
    小华 & 45 \\
    \hline
  \end{tabular}
    \caption{\small{This is a simple table for testing}}
  \end{table}
设置表格(字体)大小
同样,可以通过\small来修改,但是放置的位置和上面不同,而是放在\begin{table}之后,如:
  \begin{table}
  \centering
  \small    #改变表格字体大小,同时表格大小也会变
  \rowcolors[\hline]{2}{orange}{red!30!yellow}
  \begin{tabular}{|c|c|}
    \rowcolor{red!20}
    Name & score \\
    小明 & 50 \\
    小华 & 45 \\
    \hline
  \end{tabular}
    \caption{\small{This is a simple table for testing}}
  \end{table}
此外还有
\tiny
\scriptsize
\footnotesize
\small
\normalsize
\large
\Large
\LARGE
\huge
\Huge
彩色表格和字体
彩色表格
彩色表格需要用到宏包
\usepackage{xcolor}
没有需要按照上面的方法先安装。因为是针对表格,所以需要支持表格,使用时要如下:
\usepackage[table]{xcolor}
上面的例子可以加入彩色如下:
...
\usepackage[table]{xcolor}
...
...
  \begin{table}
  \centering
  \rowcolors[\hline]{2}{orange}{red!30!yellow}
  \begin{tabular}{|c|c|}
    \rowcolor{red!20}
    Name & score \\
    小明 & 50 \\
    小华 & 45 \\
    \hline
  \end{tabular}
    \caption{这是一个表格}
  \end{table}
结果为:
说明:
(1)第一行使用宏包xcolor,并支持table
(2)
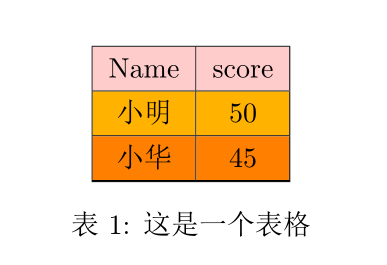
\rowcolors[\hline]{2}{orange}{red!30!yellow}
这里是表示行颜色的设置,\hline表示每行都加横线,后面表示从第二行开始奇数行用orange颜色,偶数行用30%红色和30%黄色的混合,也可以写成{red!30yellow!30}
(3)因为我们是从第二行开始加颜色,所以第一行要单独加颜色,如下
\rowcolor{red!20}
如果没有则是白色。如果想要单独每行自行设置,也可以如下单独每行设置颜色
  \begin{table}
  \centering
  \begin{tabular}{|c|c|}
  \hline
  \rowcolor{red!20}
    Name & score \\
    \hline
    \rowcolor{yellow}
    小明 & 50 \\
    \hline \rowcolor{orange}
    小华 & 45 \\
    \hline
  \end{tabular}
    \caption{这是一个表格}
  \end{table}
彩色字体
同样是xcolor包
{\color{violet}{哇,这是我的第一个 \LaTeX{} Article!}}
这一行是通过一个大花括号括起来的(即最左和最后的括号),如果没有则整篇文章都是这种颜色的字体,括起来后就只有这一句话是这个颜色。

更多颜色设置见官网 and it’s pdf article
12.4 图片表格并列
可以参考 https://tex.stackexchange.com/questions/377998/how-to-make-table-and-figure-side-by-side-appear-at-the-same-height
\begin{figure}   %开始图片(图片和表格合成一个大的图片,这里指的是整体的大图片)
\begin{minipage}[b]{.5\linewidth}     %开辟一个小页面,即用来放第一个图片
\centering
\includegraphics[width=6cm]{Figure_1.eps}
\caption{Image}
\end{minipage}%
\begin{minipage}[b]{.5\linewidth}    %开辟第二个小页面,用来放表格
\centering
\begin{tabular}{|c|c|}
\hline
aa & bb \\ \hline
cc & dd \\ \hline
\end{tabular}
\captionof{table}{Table}
\end{minipage}
%\caption{pic and table side by side}
\end{figure}
注意上面表格和图片合成了一个大的图片,同时可以对上面两个一起写注释,即将上面的
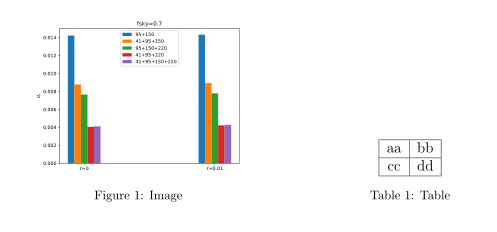
%\caption{pic and table side by side}
去掉注释即可
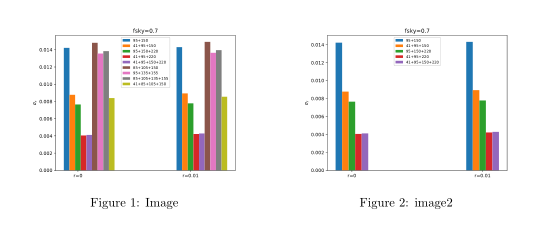
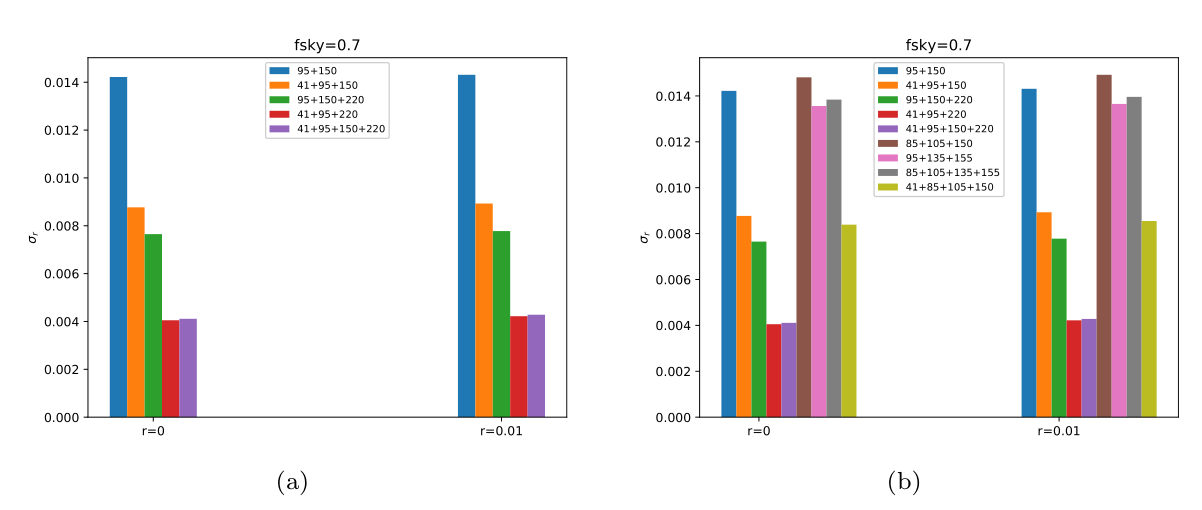
12.5 图片和图片并列
受上面的启发,我们可以将两张图片并列
\begin{document}

\begin{figure}
\begin{minipage}[b]{.5\linewidth}
\centering
\includegraphics[width=6cm]{large_full.eps}
\caption{Image}
\end{minipage}%
\begin{minipage}[b]{.5\linewidth}
\centering
\includegraphics[width=6cm]{large_part}
\caption{image2}
\end{minipage}
\end{figure}

\end{document}
除此之外,也可以使用另一种方法,如下:
\begin{figure}[htb]
  \centering
  \subfigure[]{\includegraphics[width=6.5cm]{large_part.eps}}  %[ ]里面不填就会默认为(a)
  \quad
  \subfigure[]{\includegraphics[width=6.5cm]{large_full.eps}}    %[ ]里面不填默认为(b)
  \caption{\small{The changing of uncertainty $\sigma_r$ on tensor-to-scalar ratio $r$ with the distribution of detectors on focal plane for different frequency combinations with $r$=0.01 and $\sigma_F$=0.1. Contour (a), (b) and (c) correspond to the case 0, case 1 and case 1*, respectively. }}\label{large_fig1}
\end{figure}
更新。。。。
跟第一个方法有点像:
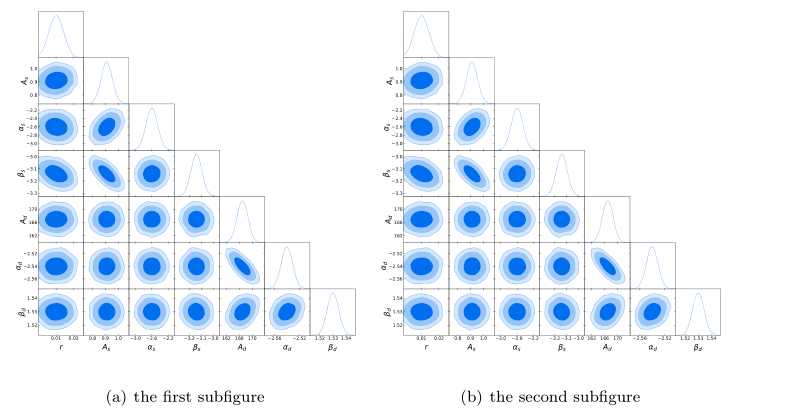
\begin{
   figure}[htb]
\centering
\subfigure[the first subfigure]{

\begin{
   minipage}[c]{
   0.4\textwidth}
\includegraphics[width=1\textwidth]{
   41_95_220_large_corre2.eps} \\
\end{
   minipage}
}
\subfigure[the second subfigure]{

\begin{
   minipage}[c]{
   0.4\textwidth}
\includegraphics[width=1\textwidth]{
   41_95_220_large_corre2.eps} \\
\end{
   minipage}
}
\end{
   figure}
如要修改图片大小,改变的是0.4的那个值,比如改为0.7
12.5 图片上下并排
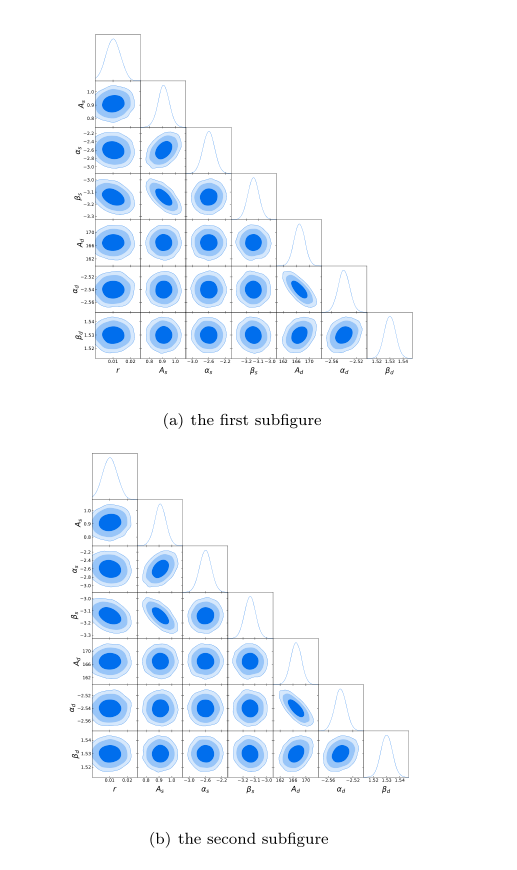
只要将上面的方法使用//来换行即可,
\begin{
   figure}[htb]
\centering
\subfigure[the first subfigure]{

\begin{
   minipage}[c]{
   0.4\textwidth}
\includegraphics[width=1\textwidth]{
   41_95_220_large_corre2.eps} \\
\end{
   minipage}
}\\   #这是唯一不同的地方,增加了//
\subfigure[the second subfigure]{

\begin{
   minipage}[c]{
   0.4\textwidth}
\includegraphics[width=1\textwidth]{
   41_95_220_large_corre2.eps} \\
\end{
   minipage}
}
\end{
   figure}
如要修改图片大小,改变的是0.4的那个值,比如改为0.7
12.6 表格和表格并列
两个表格并列
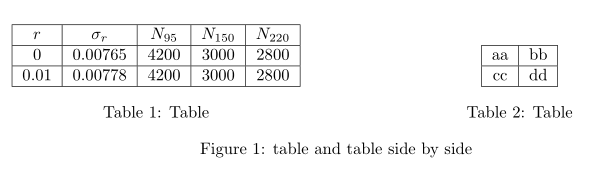
\begin{figure}   %开始图片(表格和表格合成一个大的图片,这里指的是整体的大图片)
\begin{minipage}[b]{.5\linewidth}    %开辟第一个小页面,用来放第一个表格
\centering
  \begin{tabular}{|c|c|c|c|c|}
  \hline
  $r$ & $\sigma_r$ & $N_{95}$ & $N_{150}$ & $N_{220}$\\
  \hline
  \multirow{1}*{0} & 0.00765 & 4200 & 3000 & 2800 \\
  \hline
  \multirow{1}*{0.01} & 0.00778 & 4200 & 3000 & 2800 \\
  \hline
  \end{tabular}
\captionof{table}{Table}
\end{minipage}
\begin{minipage}[b]{.5\linewidth}    %开辟第二个小页面,用来放表格
\centering
\begin{tabular}{|c|c|}
\hline
aa & bb \\ \hline
cc & dd \\ \hline
\end{tabular}
\captionof{table}{Table}
\end{minipage}
\caption{table and table side by side}
\end{figure}
可以看到有三个标注,可以通过加%去掉。另外,上面图中最后标注是figure 1 xxx, 然而我们是图表,所以只要将begin{figure}和end{figure}括号改为table即可,我就不再改了。
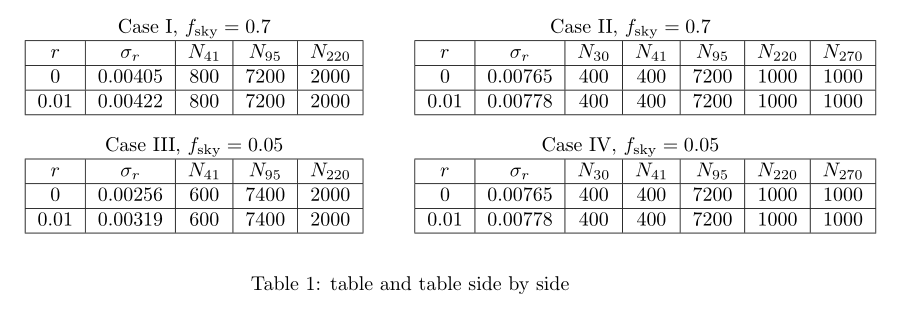
多个表格并列
\begin{table}   %开始图表
\begin{minipage}[b]{.5\linewidth}    %开辟第一个小页面,用来放第一个表格
\centering
Case I, $f_\text{sky}=0.7$
  \begin{tabular}{|c|c|c|c|c|}
  \hline
  $r$ & $\sigma_r$ & $N_{41}$ & $N_{95}$ & $N_{220}$\\
  \hline
  \multirow{1}*{0} & 0.00405 & 800 & 7200 & 2000 \\
  \hline
  \multirow{1}*{0.01} & 0.00422 & 800 & 7200 & 2000 \\
  \hline
  \end{tabular}
\end{minipage}
\vspace{0.35cm}     %调节表格间距
\begin{minipage}[b]{.5\linewidth}    %开辟第二个小页面,用来放第二个表格
\centering
Case II, $f_\text{sky}=0.7$
  \begin{tabular}{|c|c|c|c|c|c|c|}
  \hline
%  \caption{The first table}
  $r$ & $\sigma_r$ & $N_{30}$ & $N_{41}$ & $N_{95}$ & $N_{220}$ & $N_{270}$\\
  \hline
  \multirow{1}*{0} & 0.00765 & 400 & 400 & 7200 & 1000 & 1000 \\
  \hline
  \multirow{1}*{0.01} & 0.00778 & 400 & 400 & 7200 & 1000 & 1000 \\
  \hline
  \end{tabular}
\end{minipage}
\begin{minipage}[b]{.5\linewidth}    %开辟第三个小页面,用来放第三个表格
\centering
Case III, $f_\text{sky}=0.05$
  \begin{tabular}{|c|c|c|c|c|}
  \hline
  $r$ & $\sigma_r$ & $N_{41}$ & $N_{95}$ & $N_{220}$\\
  \hline
  \multirow{1}*{0} & 0.00256 & 600 & 7400 & 2000 \\
  \hline
  \multirow{1}*{0.01} & 0.00319 & 600 & 7400 & 2000 \\
  \hline
  \end{tabular}
  \end{minipage}
  \vspace{0.35cm}
\begin{minipage}[b]{.5\linewidth}    %开辟第四个小页面,用来放第四个表格
\centering
Case IV, $f_\text{sky}=0.05$
  \begin{tabular}{|c|c|c|c|c|c|c|}
  \hline
%  \caption{The first table}
  $r$ & $\sigma_r$ & $N_{30}$ & $N_{41}$ & $N_{95}$ & $N_{220}$ & $N_{270}$\\
  \hline
  \multirow{1}*{0} & 0.00765 & 400 & 400 & 7200 & 1000 & 1000 \\
  \hline
  \multirow{1}*{0.01} & 0.00778 & 400 & 400 & 7200 & 1000 & 1000 \\
  \hline
  \end{tabular}
\end{minipage}
\caption{table and table side by side}
\end{table}
注意,表格之间不要出现空行,因为空行表示换一段,所以表格会打乱。
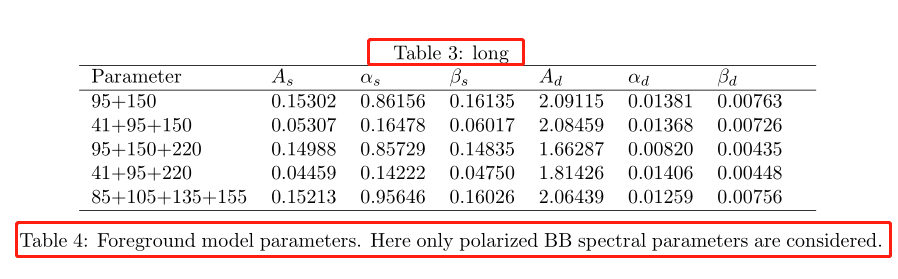
12.7 更多关于表格的举例
这个内容可以参考Latex各种表格
举例1:
先在开始加入两个包
\usepackage{
   xcolor}
\usepackage{
   colortbl,booktabs}
\begin{
   table}
\centering
\caption{
   long}
\begin{
   tabular*}{
   13cm}{
   lllllll}
\hline
Parameter & $A_s$ & $\alpha_s$ & $\beta_s$ & $A_d$& $\alpha_d$& $\beta_d$ \\
\hline
95+150 & 0.15302 & 0.86156 & 0.16135 & 2.09115 & 0.01381 & 0.00763\\
41+95+150 & 0.05307 & 0.16478 & 0.06017 & 2.08459 & 0.01368 & 0.00726\\
95+150+220 & 0.14988 & 0.85729 & 0.14835 & 1.66287 & 0.00820 & 0.00435\\
41+95+220 & 0.04459 & 0.14222 &  0.04750 & 1.81426 & 0.01406 & 0.00448\\
85+105+135+155 & 0.15213 & 0.95646 &  0.16026 & 2.06439 & 0.01259 & 0.00756\\
\hline
\end{
   tabular*}
  \caption{
   Foreground model parameters. Here only polarized BB spectral parameters are considered.}\label{
   foreground parameters}
\end{
   table}
上面有两个caption可以选择去掉其一,其中{13cm}表示表格的长度是13cm,可以自行设定。
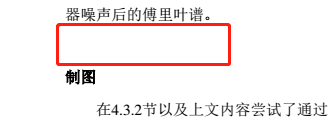
12.8 空行
空一行可以使用//来实现,但如果空了换行了还想继续空行使用//就会出错。此时使用\hspace*{\fill}\\
\hspace*{\fill}\\
\textbf{制图}
如下图,在“制图”前空了一行,
13.交叉引用(corss-reference)
关于引用部分上面已经提及了一些,上面11的(4)我们用的是\ref {xxx}这个命令。这个命令有一个缺点是它只给出图、定理等的序号,比如“如图2所示”当我们使用\ref时需要写成:
如图\ref{xxx}所示
当我们并不知道这个\ref{xxx}是图还是表格还是定理等等的时候就比较麻烦,或者我们不想输入“图”,“表格”这样的字眼,这时可以使用宏包(同样,如果没有宏包先按照上面的方法安装)
\usepackage{hyperref}
然后将\ref {xxx}改为\autoref{xxx},e.g.
......
\usepackage{hyperref}
...
...
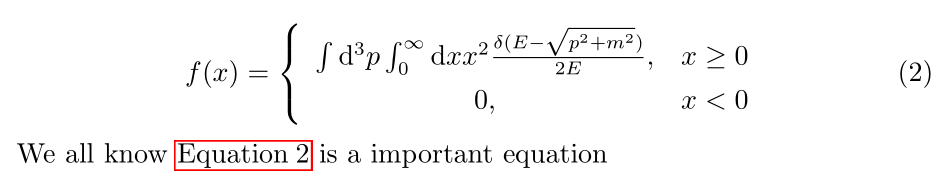
\begin{equation}
f(x)=
\left\{
\begin{array}{cc}
\int \mathrm{d}^3p\int_{0}^{\infty}\mathrm{d}x x^2 \frac{\delta(E-\sqrt{p^2+m^2})}{2E} , & x \geq 0 \\
0,& x < 0
\end{array}
\right.
\label{myequation}
\end{equation}
We all know \autoref{myequation} is a important equation
we can get:
可以看到自动加了equation这个词,而且是红色方框,点击可以直接跳到公式2.
14.文章布局
(1)页面大小
使用tex得到的pdf很窄,左右空的地方很大,如果我们想让它跟微软中的word一样的页面,可以在导言部分加入以下命令
\usepackage[top=2.54cm, bottom=2.54cm, left=3.18cm,right=3.18cm]{geometry}
(2)页眉页脚
参考文献见这里
使用宏包
\usepackage{fancyhdr}
在导言部分加入
\usepackage{fancyhdr}
\pagestyle{fancy}
\lhead{wudl}
\chead{$wudl's$ $tutorial article$}
\rhead{\thesection}
\cfoot{\thepage}
上面的结果是,页眉左上边是wudl,中间是chead中的句子,右上边是章节,页脚是页码。实际还有很多可选参数,自行查找需要的。
当然上面的页码是“1”“2”“3”这样的数,如果想要A of B,即第A页共B页,则要使用lastpage宏包。
如下:
\usepackage{fancyhdr}
\usepackage{lastpage}
\pagestyle{fancy}
\lhead{wudl}
\chead{$wudl's$ $tutorial article$}
\rhead{\thesection}
\cfoot{Page \thepage of \pageref{LastPage}}
结果为

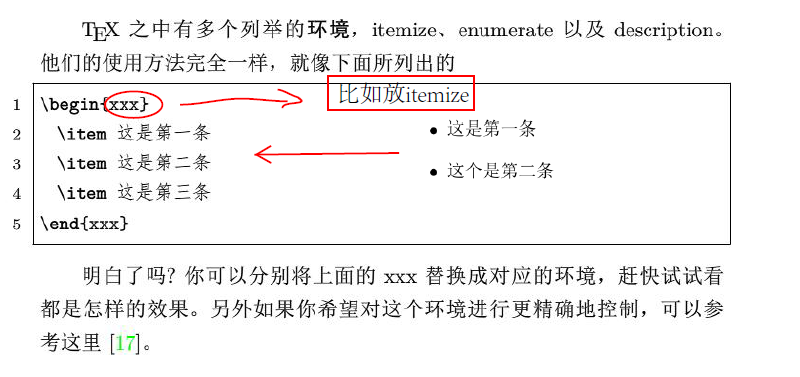
(3)列举
(4)参考文献
A.手动输入
手动输入采用thebibliography环境,手动输入适合参考文献比较少的情况
  As is stated in \cite{bibitem1} blahblah\dots
  \begin{thebibliography}{9}

  \bibitem{bibitem1}
天朝. 朕的江山和子民[M]. 朕的天朝:天朝出版社. 2018

  \bibitem{bibitem2}
blahblah(ditto)
这里\bibitem跟上面的列举中\item是一样的,上面的9表示最多可能有9条参考文献。结果为:

B.使用Bibtex
这个比较复杂,以后再补充
15.超链接
使用
hyperref
实际上面都用过这个了。
16.插入代码
参考百度知道
%导言部分
...
...
\usepackage{listings}              %加入宏包
\lstset{language=Python}           %Python语言
\lstset{breaklines}                %自动将长的代码换行排版
\lstset{extendedchars=false}       %解决代码跨页时,章节标题,页眉等汉字不显示的问题
...
...
%需要插入代码的地方
\begin{lstlisting}
放入代码
\end{lstlisting}
这样的方法是代码是没有彩色的,结果如下
解决彩色问题可以到网上找到已经修改彩色的代码,放入导言部分即可,实际上就是使用上文讲过的xcolor宏包自定义颜色。
例:自定义颜色(参考conding算子)
自定义颜色使用了listings和color两个宏包
\usepackage{listings}
\usepackage{color}

\definecolor{dkgreen}{rgb}{0,0.6,0}
\definecolor{gray}{rgb}{0.5,0.5,0.5}
\definecolor{mauve}{rgb}{0.58,0,0.82}

\lstset{ %
  language=Octave,                % the language of the code
  basicstyle=\footnotesize,           % the size of the fonts that are used for the code
  numbers=left,                   % where to put the line-numbers
  numberstyle=\tiny\color{gray},  % the style that is used for the line-numbers
  stepnumber=2,                   % the step between two line-numbers. If it's 1, each line
                                  % will be numbered
  numbersep=5pt,                  % how far the line-numbers are from the code
  backgroundcolor=\color{white},      % choose the background color. You must add \usepackage{color}
  showspaces=false,               % show spaces adding particular underscores
  showstringspaces=false,         % underline spaces within strings
  showtabs=false,                 % show tabs within strings adding particular underscores
  frame=single,                   % adds a frame around the code
  rulecolor=\color{black},        % if not set, the frame-color may be changed on line-breaks within not-black text (e.g. commens (green here))
  tabsize=2,                      % sets default tabsize to 2 spaces
  captionpos=b,                   % sets the caption-position to bottom
  breaklines=true,                % sets automatic line breaking
  breakatwhitespace=false,        % sets if automatic breaks should only happen at whitespace
  title=\lstname,                   % show the filename of files included with \lstinputlisting;
                                  % also try caption instead of title
  keywordstyle=\color{blue},          % keyword style
  commentstyle=\color{dkgreen},       % comment style
  stringstyle=\color{mauve},         % string literal style
  escapeinside={\%*}{*)},            % if you want to add LaTeX within your code
  morekeywords={*,...}               % if you want to add more keywords to the set
}
导入模块
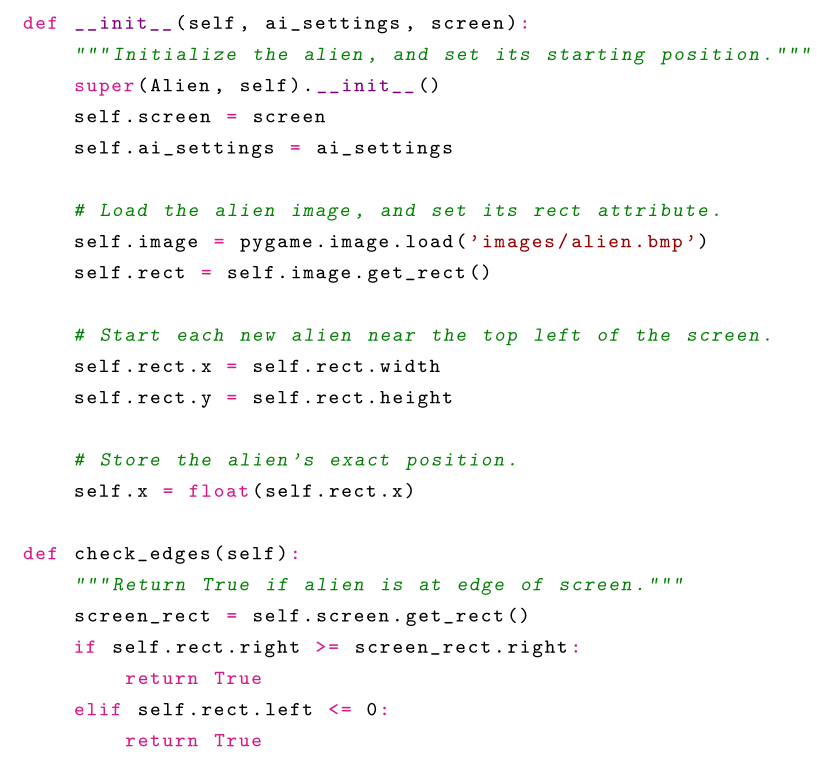
参考gaojiaxing 和 instant以python为例,下载python版本的hightlighting,地址点这里。下载完成要将pythonhighlight.sty和放在工作目录下。
可以有两种方法来加载自己写的python代码。其一是将python代码在python自己的编辑器中写完保存为.py文件放到工作目录下(如test.py),之后加载的时候只需要\inputpython…即可,这种方法可以节省大量的WinEdt书写空间
...
...
\usepackage{graphicx}
\usepackage{pythonhighlight}
...
...
\inputpython{test.py}{1}{41}#导入python文件test.py第一行到第41行
...
结果如下:
其二,可以通过
\begin{xxx}
代码
\end{xxx}
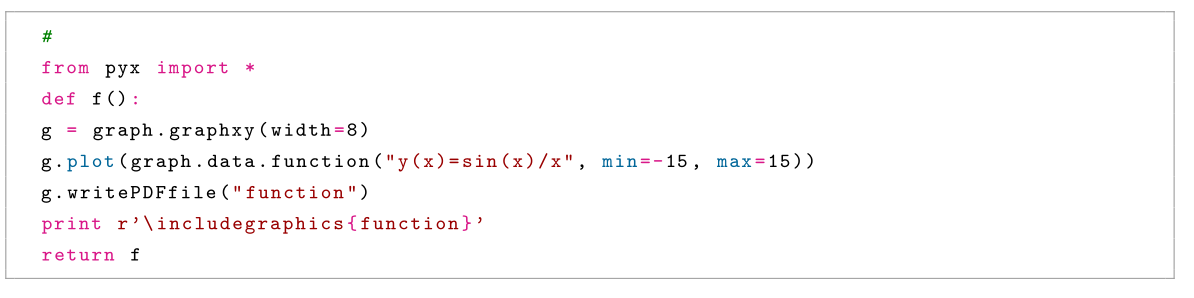
例如:
  \begin{python}
  #
  from pyx import *
  def f():
  g = graph.graphxy(width=8)
  g.plot(graph.data.function("y(x)=sin(x)/x", min=-15, max=15))
  g.writePDFfile("function")
  print r'\includegraphics{function}'
  return f
  \end{python}
结果如下;
17.目录生成
插入目录使用
\tableofcontents
注意这句话要在\begin{document}之后,end之前,例如:
\documentclass{article}
\usepackage{hyperref}
\begin{document}
\tableofcontents
\section{A section}
This is a section
\paragraph{A paragraph}
This is a paragraph
\subsection{A subsection}
This is a subsection
\end{document}
注意上面的代码使用了超链接
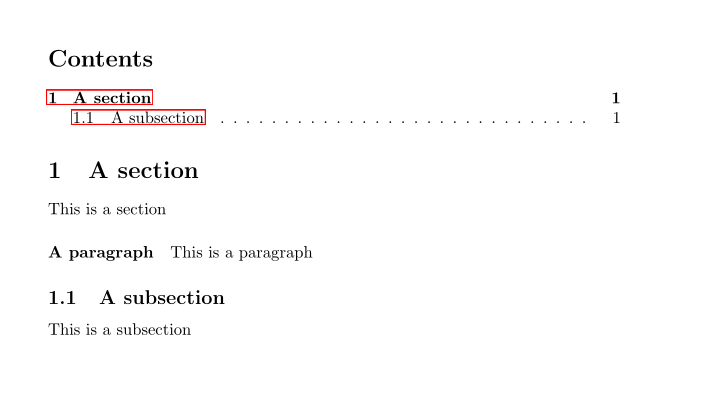
\usepackage{hyerref}
如果没有这个超链接是不会有红色部分的。
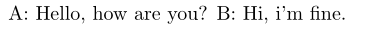
18. 段落空行, 换行和首部缩进
在latex中,默认回车是不换行的,比如在latex中输入
A: Hello, how are you?
B: Hi, i'm fine.
结果为
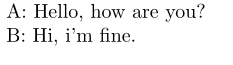
我们实际想要的是B另起一行,此时可以通过加\来实现
A: Hello, how are you?\\
B: Hi, i'm fine.
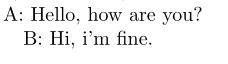
另外,如果我们希望B换行之后行首缩进,比如写段落的时候希望前面缩进两个字符等,可以直接在latex中空一行
A: Hello, how are you?

B: Hi, i'm fine.
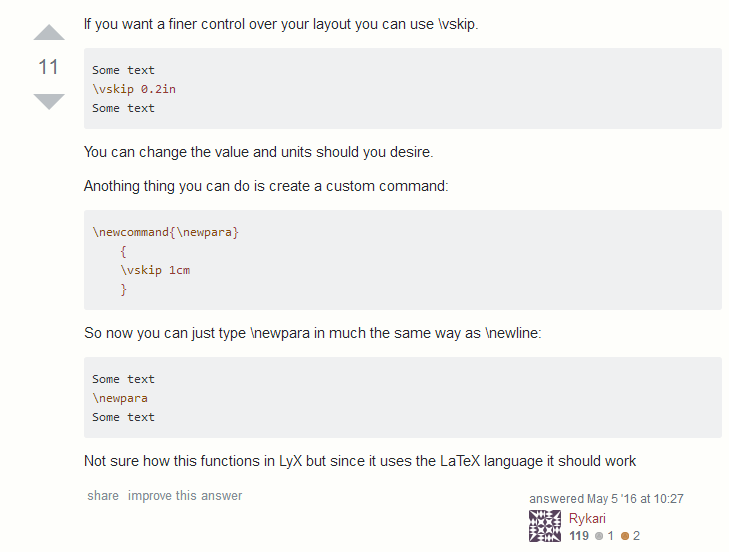
最后,如果我们希望段落之间空的行数比较多,可以使用如下两种方法: 我在此就不翻译了,链接来自:
https://tex.stackexchange.com/questions/135134/how-to-add-an-empty-line-between-paragraphs
这里需要提到的是:在定义\newcommad的时候,可以将下面的\newcommand{…}…这几行代码放在\begin{document}之前或者之后,但是笔者习惯放之前,看着比较整洁易识别。另外就是newpara是自定义的名字,你可以把它定义成任何你想要的名字。最后,使用\newcommand的时候里面的\vskip 1cm默认单位是cm,而不是inch,而第1种方法是inch.
发布者:全栈程序员-用户IM,转载请注明出处:https://javaforall.cn/138590.html原文链接:https://javaforall.cn
【正版授权,激活自己账号】: Jetbrains全家桶Ide使用,1年售后保障,每天仅需1毛
【官方授权 正版激活】: 官方授权 正版激活 支持Jetbrains家族下所有IDE 使用个人JB账号...
