大家好,又见面了,我是你们的朋友全栈君。
导读
- LEfSe(Linear discriminant analysis Effect Size)通过将用于统计显着性的标准检验与编码生物一致性和效果相关性的检验相结合,确定最有可能解释类别之间差异的特征。
- LEfSe分析可以实现多个分组之间的比较,还进行分组比较的内部进行亚组比较分析,从而找到组间在丰度上有显著差异的物种(即biomaker)。
原理
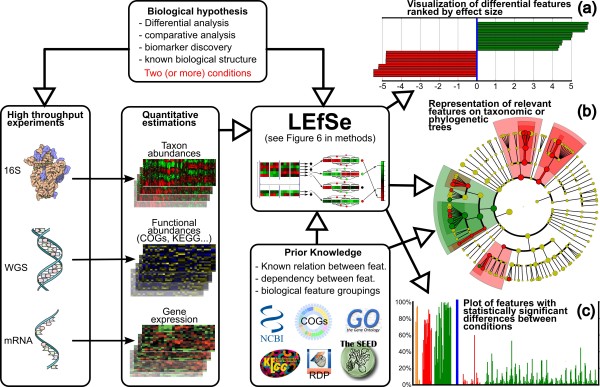

- 首先在多组样本中采用的非参数检验Kruskal-Wallis秩和检验检测不同分组间丰度差异显著的特征;
- 然后在上一步中获得的显著差异特征,用成组的Wilcoxon秩和检验进行组间差异分析(若没有亚组,该步跳过);
- 最后用线性判别分析(LDA)对数据进行分类和评估差异显著的物种的影响力(即LDA score)。
LDA score计算
计算步骤包括(详细计算过程看源码):
- 拟合lda模型,获取第一特征向量;
- 对第一特征向量进行标准化;
- 根据标准化后的第一特征向量,计算样本新坐标;
- 根据分组信息,计算组间距离,作为效应系数;
- LDA score = 效应系数 * 标准化后特征向量 ;
- 对LDA score进行log转换。
def test_lda_r(cls,feats,cl_sl,boots,fract_sample,lda_th,tol_min,nlogs):
    fk = list(feats.keys())
    means = dict([(k,[]) for k in feats.keys()])
    feats['class'] = list(cls['class'])
    clss = list(set(feats['class']))

    for uu,k in enumerate(fk):
        if k == 'class':
            continue

        ff = [(feats['class'][i],v) for i,v in enumerate(feats[k])]

        for c in clss:
            if len(set([float(v[1]) for v in ff if v[0] == c])) > max(float(feats['class'].count(c))*0.5,4):
                continue

            for i,v in enumerate(feats[k]):
                if feats['class'][i] == c:
                    feats[k][i] = math.fabs(feats[k][i] + lrand.normalvariate(0.0,max(feats[k][i]*0.05,0.01)))

    rdict = {
   }

    for a,b in feats.items():
        if a == 'class' or a == 'subclass' or a == 'subject':
            rdict[a] = robjects.StrVector(b)
        else:
            rdict[a] = robjects.FloatVector(b)

    robjects.globalenv["d"] = robjects.DataFrame(rdict)
    lfk = len(feats[fk[0]])
    rfk = int(float(len(feats[fk[0]]))*fract_sample)
    f = "class ~ "+fk[0]

    for k in fk[1:]:
        f += " + " + k.strip()

    ncl = len(set(cls['class']))
    min_cl = int(float(min([cls['class'].count(c) for c in set(cls['class'])]))*fract_sample*fract_sample*0.5)
    min_cl = max(min_cl,1)
    pairs = [(a,b) for a in set(cls['class']) for b in set(cls['class']) if a > b]

    for k in fk:
        for i in range(boots):
            means[k].append([])

    for i in range(boots):
        for rtmp in range(1000):
            rand_s = [lrand.randint(0,lfk-1) for v in range(rfk)]
            if not contast_within_classes_or_few_per_class(feats,rand_s,min_cl,ncl):
                break

        rand_s = [r+1 for r in rand_s]
        means[k][i] = []

        for p in pairs:
            robjects.globalenv["rand_s"] = robjects.IntVector(rand_s)
            robjects.globalenv["sub_d"] = robjects.r('d[rand_s,]')
            z = robjects.r('z <- suppressWarnings(lda(as.formula('+f+'),data=sub_d,tol='+str(tol_min)+'))')
            robjects.r('w <- z$scaling[,1]')
            robjects.r('w.unit <- w/sqrt(sum(w^2))')
            robjects.r('ss <- sub_d[,-match("class",colnames(sub_d))]')

            if 'subclass' in feats:
                robjects.r('ss <- ss[,-match("subclass",colnames(ss))]')

            if 'subject' in feats:
                robjects.r('ss <- ss[,-match("subject",colnames(ss))]')

            robjects.r('xy.matrix <- as.matrix(ss)')
            robjects.r('LD <- xy.matrix%*%w.unit')
            robjects.r('effect.size <- abs(mean(LD[sub_d[,"class"]=="'+p[0]+'"]) - mean(LD[sub_d[,"class"]=="'+p[1]+'"]))')
            scal = robjects.r('wfinal <- w.unit * effect.size')
            rres = robjects.r('mm <- z$means')
            rowns = list(rres.rownames)
            lenc = len(list(rres.colnames))
            coeff = [abs(float(v)) if not math.isnan(float(v)) else 0.0 for v in scal]
            res = dict([(pp,[float(ff) for ff in rres.rx(pp,True)] if pp in rowns else [0.0]*lenc ) for pp in [p[0],p[1]]])

            for j,k in enumerate(fk):
                gm = abs(res[p[0]][j] - res[p[1]][j])
                means[k][i].append((gm+coeff[j])*0.5)

    res = {
   }

    for k in fk:
        m = max([numpy.mean([means[k][kk][p] for kk in range(boots)]) for p in range(len(pairs))])
        res[k] = math.copysign(1.0,m)*math.log(1.0+math.fabs(m),10)

    return res,dict([(k,x) for k,x in res.items() if math.fabs(x) > lda_th])
安装
# 新建虚拟环境,lefse依赖于python2
conda create -n lefse python=2.7

# 激活虚拟环境
source activate lefse

# conda安装lefse
conda install lefse

# 退出虚拟环境
source deactivate
报错:如果是r2py的问题,基本都是python版本的问题。
解决:虚拟环境中重新安装python2.7(推荐)。另一种方式是对虚拟环境中的conda降级,之后再进行安装。
报错:如果是axis_bgcolor()的问题,那就是matplotlib版本问题。
解决:虚拟环境中重新安装metaplotlib 2.0版本,conda install matplotlib=2.0(推荐)。另一种方式是将lefse-plot_cladogam.py文件中的axis_bgcolor()修改为facecolor()。
分析
文件输入格式
文本制表符(单个Tab)分隔的输入文件由特征列表,分类向量和可选的亚组变量和样本ID向量组成。元数据位于前几行,特征矩阵随后。
bodysite                                mucosal         mucosal         mucosal         mucosal         mucosal         non_mucosal     non_mucosal     non_mucosal     non_mucosal     non_mucosal
subsite                                 oral            gut             oral            oral            gut             skin            nasal           skin            ear             nasal
id                                      1023            1023            1672            1876            1672            159005010       1023            1023            1023            1672
Bacteria                                0.99999         0.99999         0.999993        0.999989        0.999997        0.999927        0.999977        0.999987        0.999997        0.999993
Bacteria|Actinobacteria                 0.311037        0.000864363     0.00446132      0.0312045       0.000773642     0.359354        0.761108        0.603002        0.95913         0.753688
Bacteria|Bacteroidetes                  0.0689602       0.804293        0.00983343      0.0303561       0.859838        0.0195298       0.0212741       0.145729        0.0115617       0.0114511
Bacteria|Firmicutes                     0.494223        0.173411        0.715345        0.813046        0.124552        0.177961        0.189178        0.188964        0.0226835       0.192665
Bacteria|Proteobacteria                 0.0914284       0.0180378       0.265664        0.109549        0.00941215      0.430869        0.0225884       0.0532684       0.00512034      0.0365453
Bacteria|Firmicutes|Clostridia          0.090041        0.170246        0.00483188      0.0465328       0.122702        0.0402301       0.0460614       0.135201        0.0115835       0.0537381
数据格式转换
数据分析前需要对数据格式进行转换,原始数据可以为16S那种reads count,也可以是宏基因组相对丰度数据,但需要按照指定格式,行为分组和物种信息,列为样本。-c指定分组行;-s指定亚组行,若没有可以不指定;-u指定样本编号;-o指定归一化后范围,主要针对宏基因组数据,目的是对相对丰度进行放大。
lefse-format_input.py hmp_aerobiosis_small.txt hmp_aerobiosis_small.in -c 1 -s 2 -u 3 -o 1000000
详细参数:
usage: lefse-format_input.py [-h] [--output_table OUTPUT_TABLE] [-f {
   c,r}]
                             [-c [1..n_feats]] [-s [1..n_feats]] [-o float]
                             [-u [1..n_feats]] [-m {
   f,s}] [-n int]
                             [-biom_c BIOM_CLASS] [-biom_s BIOM_SUBCLASS]
                             INPUT_FILE OUTPUT_FILE

LEfSe formatting modules

positional arguments:
  INPUT_FILE            the input file, feature hierarchical level can be
                        specified with | or . and those symbols must not be
                        present for other reasons in the input file.
  OUTPUT_FILE           the output file containing the data for LEfSe

optional arguments:
  -h, --help            show this help message and exit
  --output_table OUTPUT_TABLE
                        the formatted table in txt format
  -f {
   c,r}              set whether the features are on rows (default) or on
                        columns
  -c [1..n_feats]       set which feature use as class (default 1)
  -s [1..n_feats]       set which feature use as subclass (default -1 meaning
                        no subclass)
  -o float              set the normalization value (default -1.0 meaning no
                        normalization)
  -u [1..n_feats]       set which feature use as subject (default -1 meaning
                        no subject)
  -m {
   f,s}              set the policy to adopt with missin values: f removes
                        the features with missing values, s removes samples
                        with missing values (default f)
  -n int                set the minimum cardinality of each subclass
                        (subclasses with low cardinalities will be grouped
                        together, if the cardinality is still low, no pairwise
                        comparison will be performed with them)
  -biom_c BIOM_CLASS    For biom input files: Set which feature use as class
  -biom_s BIOM_SUBCLASS
                        For biom input files: set which feature use as
                        subclass
lefse分析
转换格式后,可以进行lefse差异分析。需要指定输入和输出文件。还可以通过-a指定组间比较检验水准阈值,-w指定成组比较检验水准阈值,-l指定lda score阈值。除了可以选择lda,还可以选择svm进行分析。
run_lefse.py hmp_aerobiosis_small.in hmp_aerobiosis_small.res
详细参数:
usage: run_lefse.py [-h] [-o str] [-a float] [-w float] [-l float]
                    [--nlogs int] [--verbose int] [--wilc int] [-r str]
                    [--svm_norm int] [-b int] [-e int] [-c int] [-f float]
                    [-s {
   0,1,2}] [--min_c int] [-t str] [-y {
   0,1}]
                    INPUT_FILE OUTPUT_FILE

LEfSe 1.0

positional arguments:
  INPUT_FILE      the input file
  OUTPUT_FILE     the output file containing the data for the visualization
                  module

optional arguments:
  -h, --help      show this help message and exit
  -o str          set the file for exporting the result (only concise textual
                  form)
  -a float        set the alpha value for the Anova test (default 0.05)
  -w float        set the alpha value for the Wilcoxon test (default 0.05)
  -l float        set the threshold on the absolute value of the logarithmic
                  LDA score (default 2.0)
  --nlogs int     max log ingluence of LDA coeff
  --verbose int   verbose execution (default 0)
  --wilc int      wheter to perform the Wicoxon step (default 1)
  -r str          select LDA or SVM for effect size (default LDA)
  --svm_norm int  whether to normalize the data in [0,1] for SVM feature
                  waiting (default 1 strongly suggested)
  -b int          set the number of bootstrap iteration for LDA (default 30)
  -e int          set whether perform the wilcoxon test only among the
                  subclasses with the same name (default 0)
  -c int          set whether perform the wilcoxon test ing the Curtis's
                  approach [BETA VERSION] (default 0)
  -f float        set the subsampling fraction value for each bootstrap
                  iteration (default 0.66666)
  -s {
   0,1,2}      set the multiple testing correction options. 0 no correction
                  (more strict, default), 1 correction for independent
                  comparisons, 2 correction for independent comparison
  --min_c int     minimum number of samples per subclass for performing
                  wilcoxon test (default 10)
  -t str          set the title of the analysis (default input file without
                  extension)
  -y {
   0,1}        (for multiclass tasks) set whether the test is performed in
                  a one-against-one ( 1 - more strict!) or in a one-against-
                  all setting ( 0 - less strict) (default 0)
绘制lefse结果图
将lefse分析结果绘图。可以根据需求指定绘图格式。
lefse-plot_res.py hmp_aerobiosis_small.res hmp_aerobiosis_small.png
详细参数:
usage: lefse-plot_res.py [-h] [--feature_font_size FEATURE_FONT_SIZE]
                         [--format {
   png,svg,pdf}] [--dpi DPI] [--title TITLE]
                         [--title_font_size TITLE_FONT_SIZE]
                         [--class_legend_font_size CLASS_LEGEND_FONT_SIZE]
                         [--width WIDTH] [--height HEIGHT] [--left_space LS]
                         [--right_space RS] [--orientation {
   h,v}]
                         [--autoscale {
   0,1}] [--background_color {
   k,w}]
                         [--subclades N_SCL]
                         [--max_feature_len MAX_FEATURE_LEN]
                         [--all_feats ALL_FEATS] [--otu_only]
                         [--report_features]
                         INPUT_FILE OUTPUT_FILE

Plot results

positional arguments:
  INPUT_FILE            tab delimited input file
  OUTPUT_FILE           the file for the output image

optional arguments:
  -h, --help            show this help message and exit
  --feature_font_size FEATURE_FONT_SIZE
                        the file for the output image
  --format {
   png,svg,pdf}
                        the format for the output file
  --dpi DPI
  --title TITLE
  --title_font_size TITLE_FONT_SIZE
  --class_legend_font_size CLASS_LEGEND_FONT_SIZE
  --width WIDTH
  --height HEIGHT       only for vertical histograms
  --left_space LS
  --right_space RS
  --orientation {
   h,v}
  --autoscale {
   0,1}
  --background_color {
   k,w}
                        set the color of the background
  --subclades N_SCL     number of label levels to be dislayed (starting from
                        the leaves, -1 means all the levels, 1 is default )
  --max_feature_len MAX_FEATURE_LEN
                        Maximum length of feature strings (def 60)
  --all_feats ALL_FEATS
  --otu_only            Plot only species resolved OTUs (as opposed to all
                        levels)
  --report_features     Report important features to STDOUT
绘制特征条形图
另外,可以分别对指定的物种,或者所以差异物种绘制条形图。
# 单个特征
lefse-plot_features.py -f one --feature_name "Bacteria.Bacteroidetes" hmp_aerobiosis_small.in hmp_aerobiosis_small.res Bacteroidetes.png

# 差异特征
lefse-plot_features.py -f diff --archive zip hmp_aerobiosis_small.in hmp_aerobiosis_small.res biomarkers.zip
详细参数:
usage: lefse-plot_features.py [-h] [--width WIDTH] [--height HEIGHT]
                              [--top TOP] [--bot BOT]
                              [--title_font_size TITLE_FONT_SIZE]
                              [--class_font_size CLASS_FONT_SIZE]
                              [--class_label_pos {
   up,down}]
                              [--subcl_mean {
   y,n}] [--subcl_median {
   y,n}]
                              [--font_size FONT_SIZE] [-n flt]
                              [--format {
   png,pdf,svg}] [-f {
   all,diff,one}]
                              [--feature_name FEATURE_NAME]
                              [--feature_num FEATURE_NUM]
                              [--archive {
   zip,none}]
                              [--background_color {
   k,w}] [--dpi DPI]
                              INPUT_FILE INPUT_FILE OUTPUT_FILE

Cladoplot

positional arguments:
  INPUT_FILE            dataset files
  INPUT_FILE            LEfSe output file
  OUTPUT_FILE           the file for the output (the zip file if an archive is
                        required, the output directory otherwise)

optional arguments:
  -h, --help            show this help message and exit
  --width WIDTH
  --height HEIGHT
  --top TOP             set maximum y limit (-1.0 means automatic limit)
  --bot BOT             set minimum y limit (default 0.0, -1.0 means automatic
                        limit)
  --title_font_size TITLE_FONT_SIZE
  --class_font_size CLASS_FONT_SIZE
  --class_label_pos {
   up,down}
  --subcl_mean {
   y,n}
  --subcl_median {
   y,n}
  --font_size FONT_SIZE
  -n flt                unused
  --format {
   png,pdf,svg}
                        the format for the output file
  -f {
   all,diff,one}     wheter to plot all features (all), only those
                        differentially abundant according to LEfSe or only one
                        (the one given with --feature_name)
  --feature_name FEATURE_NAME
                        The name of the feature to plot (levels separated by
                        .)
  --feature_num FEATURE_NUM
                        The number of the feature to plot
  --archive {
   zip,none}
  --background_color {
   k,w}
                        set the color of the background
  --dpi DPI
绘制系统发育树图
可以将差异结果,结合物种进化关系,绘制系统发育树图。前提是输入文件必须指定物种所有的物种等级。例如metaphlan的输出结果。如果物种太多,可以进一步对差异分析结果进行筛选过滤,只对差异特征进行绘图。
## 可直接绘制单个水平的图,也可将所有水平进行分析后,得到的结果进行绘图
## 如果很多特征都是没有组间差异的,可以对特征进行筛选后再绘图 grep -v '-' 即可
## --clade_sep 默认为1.5,但绘图时会自动调整,也可以自己设定
## --abrv_stop_lev 7 默认为5,即展示到第5水平,可设置到7,暂时到第7水平的结果。可以结合标签参数和缩写参数来展示。
lefse-plot_cladogram.py --dpi 500 all_level_lefse_significant.res all_level_lefse_significant_cladogram.pdf --format pdf --clade_sep 0.05 --abrv_stop_lev 7
详细参数:
usage: lefse-plot_cladogram.py [-h] [--clade_sep CLADE_SEP]
                               [--max_lev MAX_LEV]
                               [--max_point_size MAX_POINT_SIZE]
                               [--min_point_size MIN_POINT_SIZE]
                               [--point_edge_width MARKEREDGEWIDTH]
                               [--siblings_connector_width SIBLINGS_CONNECTOR_WIDTH]
                               [--parents_connector_width PARENTS_CONNECTOR_WIDTH]
                               [--radial_start_lev RADIAL_START_LEV]
                               [--labeled_start_lev LABELED_START_LEV]
                               [--labeled_stop_lev LABELED_STOP_LEV]
                               [--abrv_start_lev ABRV_START_LEV]
                               [--abrv_stop_lev ABRV_STOP_LEV]
                               [--expand_void_lev EXPAND_VOID_LEV]
                               [--class_legend_vis CLASS_LEGEND_VIS]
                               [--colored_connector COLORED_CONNECTORS]
                               [--alpha ALPHA] [--title TITLE]
                               [--sub_clade SUB_CLADE]
                               [--title_font_size TITLE_FONT_SIZE]
                               [--right_space_prop R_PROP]
                               [--left_space_prop L_PROP]
                               [--label_font_size LABEL_FONT_SIZE]
                               [--background_color {
   k,w}]
                               [--colored_labels {
   0,1}]
                               [--class_legend_font_size CLASS_LEGEND_FONT_SIZE]
                               [--dpi DPI] [--format {
   png,svg,pdf}]
                               [--all_feats ALL_FEATS]
                               INPUT_FILE OUTPUT_FILE

Cladoplot

positional arguments:
  INPUT_FILE            tab delimited input file
  OUTPUT_FILE           the file for the output image

optional arguments:
  -h, --help            show this help message and exit
  --clade_sep CLADE_SEP
  --max_lev MAX_LEV
  --max_point_size MAX_POINT_SIZE
  --min_point_size MIN_POINT_SIZE
  --point_edge_width MARKEREDGEWIDTH
  --siblings_connector_width SIBLINGS_CONNECTOR_WIDTH
  --parents_connector_width PARENTS_CONNECTOR_WIDTH
  --radial_start_lev RADIAL_START_LEV
  --labeled_start_lev LABELED_START_LEV
  --labeled_stop_lev LABELED_STOP_LEV
  --abrv_start_lev ABRV_START_LEV
  --abrv_stop_lev ABRV_STOP_LEV
  --expand_void_lev EXPAND_VOID_LEV
  --class_legend_vis CLASS_LEGEND_VIS
  --colored_connector COLORED_CONNECTORS
  --alpha ALPHA
  --title TITLE
  --sub_clade SUB_CLADE
  --title_font_size TITLE_FONT_SIZE
  --right_space_prop R_PROP
  --left_space_prop L_PROP
  --label_font_size LABEL_FONT_SIZE
  --background_color {
   k,w}
                        set the color of the background
  --colored_labels {
   0,1}
                        draw the label with class color (1) or in black (0)
  --class_legend_font_size CLASS_LEGEND_FONT_SIZE
  --dpi DPI
  --format {
   png,svg,pdf}
                        the format for the output file
  --all_feats ALL_FEATS
参考资料
https://github.com/SegataLab/lefse
发布者:全栈程序员-用户IM,转载请注明出处:https://javaforall.cn/135291.html原文链接:https://javaforall.cn
【正版授权,激活自己账号】: Jetbrains全家桶Ide使用,1年售后保障,每天仅需1毛
【官方授权 正版激活】: 官方授权 正版激活 支持Jetbrains家族下所有IDE 使用个人JB账号...
