
redis数据库windows客户端下载地址:https://github.com/dmajkic/redis/downloads
原文链接:http://redis.io/topics/benchmarks
How fast is Redis?
Redis includes the redis-benchmark utility that simulates SETs/GETs done by N clients at the same time sending M total queries (it is similar to the Apache’s ab utility). Below you’ll find the full output of a benchmark executed against a Linux box.
The following options are supported:
Usage: redis-benchmark [-h <host>] [-p <port>] [-c <clients>] [-n <requests]> [-k <boolean>]

-h <hostname>      Server hostname (default 127.0.0.1)
-p <port>          Server port (default 6379)
-s <socket>        Server socket (overrides host and port)
-c <clients>       Number of parallel connections (default 50)
-n <requests>      Total number of requests (default 10000)
-d <size>          Data size of SET/GET value in bytes (default 2)
-k <boolean>       1=keep alive 0=reconnect (default 1)
-r <keyspacelen>   Use random keys for SET/GET/INCR, random values for SADD
  Using this option the benchmark will get/set keys
  in the form mykey_rand:000000012456 instead of constant
  keys, the <keyspacelen> argument determines the max
  number of values for the random number. For instance
  if set to 10 only rand:000000000000 - rand:000000000009
  range will be allowed.
-P <numreq>        Pipeline <numreq> requests. Default 1 (no pipeline).
-q                 Quiet. Just show query/sec values
--csv              Output in CSV format
-l                 Loop. Run the tests forever
-t <tests>         Only run the comma separated list of tests. The test
                    names are the same as the ones produced as output.
-I                 Idle mode. Just open N idle connections and wait.
You need to have a running Redis instance before launching the benchmark. A typical example would be:
redis-benchmark -q -n 100000Using this tool is quite easy, and you can also write your own benchmark, but as with any benchmarking activity, there are some pitfalls to avoid.
Pitfalls and misconceptions
The first point is obvious: the golden rule of a useful benchmark is to only compare apples and apples. Different versions of Redis can be compared on the same workload for instance. Or the same version of Redis, but with different options. If you plan to compare Redis to something else, then it is important to evaluate the functional and technical differences, and take them in account.
- Redis is a server: all commands involve network or IPC roundtrips. It is meaningless to compare it to embedded data stores such as SQLite, Berkeley DB, Tokyo/Kyoto Cabinet, etc … because the cost of most operations is precisely dominated by network/protocol management.
- Redis commands return an acknowledgment for all usual commands. Some other data stores do not (for instance MongoDB does not implicitly acknowledge write operations). Comparing Redis to stores involving one-way queries is only mildly useful.
- Naively iterating on synchronous Redis commands does not benchmark Redis itself, but rather measure your network (or IPC) latency. To really test Redis, you need multiple connections (like redis-benchmark) and/or to use pipelining to aggregate several commands and/or multiple threads or processes.
- Redis is an in-memory data store with some optional persistency options. If you plan to compare it to transactional servers (MySQL, PostgreSQL, etc …), then you should consider activating AOF and decide of a suitable fsync policy.
- Redis is a single-threaded server. It is not designed to benefit from multiple CPU cores. People are supposed to launch several Redis instances to scale out on several cores if needed. It is not really fair to compare one single Redis instance to a multi-threaded data store.
A common misconception is that redis-benchmark is designed to make Redis performances look stellar, the throughput achieved by redis-benchmark being somewhat artificial, and not achievable by a real application. This is actually plain wrong.
The redis-benchmark program is a quick and useful way to get some figures and evaluate the performance of a Redis instance on a given hardware. However, by default, it does not represent the maximum throughput a Redis instance can sustain. Actually, by using pipelining and a fast client (hiredis), it is fairly easy to write a program generating more throughput than redis-benchmark. The default behavior of redis-benchmark is to achieve throughput by exploiting concurrency only (i.e. it creates several connections to the server). It does not use pipelining or any parallelism at all (one pending query per connection at most, and no multi-threading).
To run a benchmark using pipelining mode (and achieve higher throughputs), you need to explicitly use the -P option. Please note that it is still a realistic behavior since a lot of Redis based applications actively use pipelining to improve performance.
Finally, the benchmark should apply the same operations, and work in the same way with the multiple data stores you want to compare. It is absolutely pointless to compare the result of redis-benchmark to the result of another benchmark program and extrapolate.
For instance, Redis and memcached in single-threaded mode can be compared on GET/SET operations. Both are in-memory data stores, working mostly in the same way at the protocol level. Provided their respective benchmark application is aggregating queries in the same way (pipelining) and use a similar number of connections, the comparison is actually meaningful.
This perfect example is illustrated by the dialog between Redis (antirez) and memcached (dormando) developers.
antirez 1 – On Redis, Memcached, Speed, Benchmarks and The Toilet
dormando – Redis VS Memcached (slightly better bench)
antirez 2 – An update on the Memcached/Redis benchmark
You can see that in the end, the difference between the two solutions is not so staggering, once all technical aspects are considered. Please note both Redis and memcached have been optimized further after these benchmarks …
Finally, when very efficient servers are benchmarked (and stores like Redis or memcached definitely fall in this category), it may be difficult to saturate the server. Sometimes, the performance bottleneck is on client side, and not server-side. In that case, the client (i.e. the benchmark program itself) must be fixed, or perhaps scaled out, in order to reach the maximum throughput.
Factors impacting Redis performance
There are multiple factors having direct consequences on Redis performance. We mention them here, since they can alter the result of any benchmarks. Please note however, that a typical Redis instance running on a low end, non tuned, box usually provides good enough performance for most applications.
- Network bandwidth and latency usually have a direct impact on the performance. It is a good practice to use the ping program to quickly check the latency between the client and server hosts is normal before launching the benchmark. Regarding the bandwidth, it is generally useful to estimate the throughput in Gbits/s and compare it to the theoretical bandwidth of the network. For instance a benchmark setting 4 KB strings in Redis at 100000 q/s, would actually consume 3.2 Gbits/s of bandwidth and probably fit with a 10 GBits/s link, but not a 1 Gbits/s one. In many real world scenarios, Redis throughput is limited by the network well before being limited by the CPU. To consolidate several high-throughput Redis instances on a single server, it worth considering putting a 10 Gbits/s NIC or multiple 1 Gbits/s NICs with TCP/IP bonding.
- CPU is another very important factor. Being single-threaded, Redis favors fast CPUs with large caches and not many cores. At this game, Intel CPUs are currently the winners. It is not uncommon to get only half the performance on an AMD Opteron CPU compared to similar Nehalem EP/Westmere EP/Sandy bridge Intel CPUs with Redis. When client and server run on the same box, the CPU is the limiting factor with redis-benchmark.
- Speed of RAM and memory bandwidth seem less critical for global performance especially for small objects. For large objects (>10 KB), it may become noticeable though. Usually, it is not really cost effective to buy expensive fast memory modules to optimize Redis.
- Redis runs slower on a VM. Virtualization toll is quite high because for many common operations, Redis does not add much overhead on top of the required system calls and network interruptions. Prefer to run Redis on a physical box, especially if you favor deterministic latencies. On a state-of-the-art hypervisor (VMWare), result of redis-benchmark on a VM through the physical network is almost divided by 2 compared to the physical machine, with some significant CPU time spent in system and interruptions.
- When the server and client benchmark programs run on the same box, both the TCP/IP loopback and unix domain sockets can be used. It depends on the platform, but unix domain sockets can achieve around 50% more throughput than the TCP/IP loopback (on Linux for instance). The default behavior of redis-benchmark is to use the TCP/IP loopback.
- The performance benefit of unix domain sockets compared to TCP/IP loopback tends to decrease when pipelining is heavily used (i.e. long pipelines).
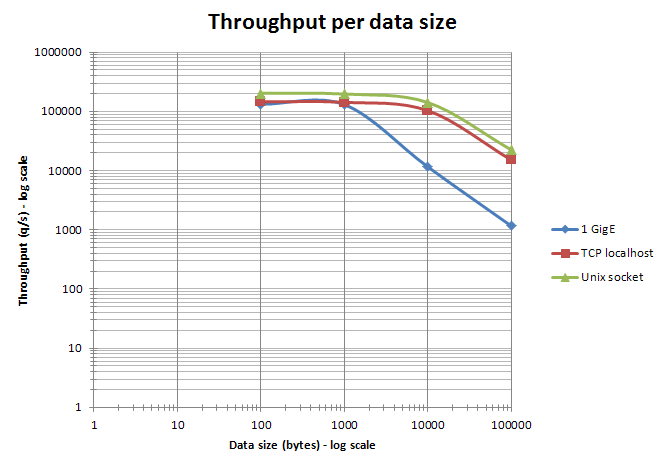
- When an ethernet network is used to access Redis, aggregating commands using pipelining is especially efficient when the size of the data is kept under the ethernet packet size (about 1500 bytes). Actually, processing 10 bytes, 100 bytes, or 1000 bytes queries almost result in the same throughput. See the graph below.

- On multi CPU sockets servers, Redis performance becomes dependant on the NUMA configuration and process location. The most visible effect is that redis-benchmark results seem non deterministic because client and server processes are distributed randomly on the cores. To get deterministic results, it is required to use process placement tools (on Linux: taskset or numactl). The most efficient combination is always to put the client and server on two different cores of the same CPU to benefit from the L3 cache. Here are some results of 4 KB SET benchmark for 3 server CPUs (AMD Istanbul, Intel Nehalem EX, and Intel Westmere) with different relative placements. Please note this benchmark is not meant to compare CPU models between themselves (CPUs exact model and frequency are therefore not disclosed).

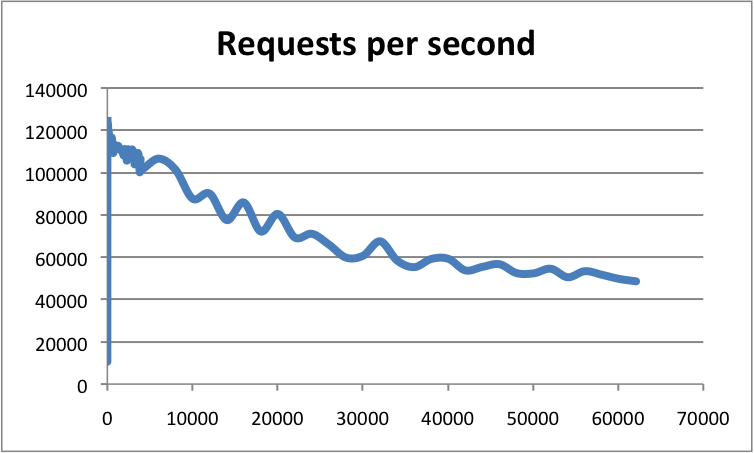
- With high-end configurations, the number of client connections is also an important factor. Being based on epoll/kqueue, Redis event loop is quite scalable. Redis has already been benchmarked at more than 60000 connections, and was still able to sustain 50000 q/s in these conditions. As a rule of thumb, an instance with 30000 connections can only process half the throughput achievable with 100 connections. Here is an example showing the throughput of a Redis instance per number of connections:
- With high-end configurations, it is possible to achieve higher throughput by tuning the NIC(s) configuration and associated interruptions. Best throughput is achieved by setting an affinity between Rx/Tx NIC queues and CPU cores, and activating RPS (Receive Packet Steering) support. More information in this thread. Jumbo frames may also provide a performance boost when large objects are used.
- Depending on the platform, Redis can be compiled against different memory allocators (libc malloc, jemalloc, tcmalloc), which may have different behaviors in term of raw speed, internal and external fragmentation. If you did not compile Redis by yourself, you can use the INFO command to check the mem_allocator field. Please note most benchmarks do not run long enough to generate significant external fragmentation (contrary to production Redis instances).
Other things to consider
One important goal of any benchmark is to get reproducible results, so they can be compared to the results of other tests.
- A good practice is to try to run tests on isolated hardware as far as possible. If it is not possible, then the system must be monitored to check the benchmark is not impacted by some external activity.
- Some configurations (desktops and laptops for sure, some servers as well) have a variable CPU core frequency mechanism. The policy controlling this mechanism can be set at the OS level. Some CPU models are more aggressive than others at adapting the frequency of the CPU cores to the workload. To get reproducible results, it is better to set the highest possible fixed frequency for all the CPU cores involved in the benchmark.
- An important point is to size the system accordingly to the benchmark. The system must have enough RAM and must not swap. On Linux, do not forget to set the overcommit_memory parameter correctly. Please note 32 and 64 bits Redis instances have not the same memory footprint.
- If you plan to use RDB or AOF for your benchmark, please check there is no other I/O activity in the system. Avoid putting RDB or AOF files on NAS or NFS shares, or on any other devices impacting your network bandwidth and/or latency (for instance, EBS on Amazon EC2).
- Set Redis logging level (loglevel parameter) to warning or notice. Avoid putting the generated log file on a remote filesystem.
- Avoid using monitoring tools which can alter the result of the benchmark. For instance using INFO at regular interval to gather statistics is probably fine, but MONITOR will impact the measured performance significantly.
Example of benchmark result
- The test was done with 50 simultaneous clients performing 100000 requests.
- The value SET and GET is a 256 bytes string.
- The Linux box is running Linux 2.6, it’s Xeon X3320 2.5 GHz.
- Text executed using the loopback interface (127.0.0.1).
Results: about 110000 SETs per second, about 81000 GETs per second.
Latency percentiles
$ redis-benchmark -n 100000

====== SET ======
  100007 requests completed in 0.88 seconds
  50 parallel clients
  3 bytes payload
  keep alive: 1

58.50% <= 0 milliseconds
99.17% <= 1 milliseconds
99.58% <= 2 milliseconds
99.85% <= 3 milliseconds
99.90% <= 6 milliseconds
100.00% <= 9 milliseconds
114293.71 requests per second

====== GET ======
  100000 requests completed in 1.23 seconds
  50 parallel clients
  3 bytes payload
  keep alive: 1

43.12% <= 0 milliseconds
96.82% <= 1 milliseconds
98.62% <= 2 milliseconds
100.00% <= 3 milliseconds
81234.77 requests per second

====== INCR ======
  100018 requests completed in 1.46 seconds
  50 parallel clients
  3 bytes payload
  keep alive: 1

32.32% <= 0 milliseconds
96.67% <= 1 milliseconds
99.14% <= 2 milliseconds
99.83% <= 3 milliseconds
99.88% <= 4 milliseconds
99.89% <= 5 milliseconds
99.96% <= 9 milliseconds
100.00% <= 18 milliseconds
68458.59 requests per second

====== LPUSH ======
  100004 requests completed in 1.14 seconds
  50 parallel clients
  3 bytes payload
  keep alive: 1

62.27% <= 0 milliseconds
99.74% <= 1 milliseconds
99.85% <= 2 milliseconds
99.86% <= 3 milliseconds
99.89% <= 5 milliseconds
99.93% <= 7 milliseconds
99.96% <= 9 milliseconds
100.00% <= 22 milliseconds
100.00% <= 208 milliseconds
88109.25 requests per second

====== LPOP ======
  100001 requests completed in 1.39 seconds
  50 parallel clients
  3 bytes payload
  keep alive: 1

54.83% <= 0 milliseconds
97.34% <= 1 milliseconds
99.95% <= 2 milliseconds
99.96% <= 3 milliseconds
99.96% <= 4 milliseconds
100.00% <= 9 milliseconds
100.00% <= 208 milliseconds
71994.96 requests per second
Notes: changing the payload from 256 to 1024 or 4096 bytes does not change the numbers significantly (but reply packets are glued together up to 1024 bytes so GETs may be slower with big payloads). The same for the number of clients, from 50 to 256 clients I got the same numbers. With only 10 clients it starts to get a bit slower.
You can expect different results from different boxes. For example a low profile box like Intel core duo T5500 clocked at 1.66 GHz running Linux 2.6 will output the following:
$ ./redis-benchmark -q -n 100000
SET: 53684.38 requests per second
GET: 45497.73 requests per second
INCR: 39370.47 requests per second
LPUSH: 34803.41 requests per second
LPOP: 37367.20 requests per second
Another one using a 64 bit box, a Xeon L5420 clocked at 2.5 GHz:
$ ./redis-benchmark -q -n 100000
PING: 111731.84 requests per second
SET: 108114.59 requests per second
GET: 98717.67 requests per second
INCR: 95241.91 requests per second
LPUSH: 104712.05 requests per second
LPOP: 93722.59 requests per second
Example of benchmark results with optimized high-end server hardware
- Redis version 2.4.2
- Default number of connections, payload size = 256
- The Linux box is running SLES10 SP3 2.6.16.60-0.54.5-smp, CPU is 2 x Intel X5670 @ 2.93 GHz.
- Text executed while running redis server and benchmark client on the same CPU, but different cores.
Using a unix domain socket:
$ numactl -C 6 ./redis-benchmark -q -n 100000 -s /tmp/redis.sock -d 256
PING (inline): 200803.22 requests per second
PING: 200803.22 requests per second
MSET (10 keys): 78064.01 requests per second
SET: 198412.69 requests per second
GET: 198019.80 requests per second
INCR: 200400.80 requests per second
LPUSH: 200000.00 requests per second
LPOP: 198019.80 requests per second
SADD: 203665.98 requests per second
SPOP: 200803.22 requests per second
LPUSH (again, in order to bench LRANGE): 200000.00 requests per second
LRANGE (first 100 elements): 42123.00 requests per second
LRANGE (first 300 elements): 15015.02 requests per second
LRANGE (first 450 elements): 10159.50 requests per second
LRANGE (first 600 elements): 7548.31 requests per second
Using the TCP loopback:
$ numactl -C 6 ./redis-benchmark -q -n 100000 -d 256
PING (inline): 145137.88 requests per second
PING: 144717.80 requests per second
MSET (10 keys): 65487.89 requests per second
SET: 142653.36 requests per second
GET: 142450.14 requests per second
INCR: 143061.52 requests per second
LPUSH: 144092.22 requests per second
LPOP: 142247.52 requests per second
SADD: 144717.80 requests per second
SPOP: 143678.17 requests per second
LPUSH (again, in order to bench LRANGE): 143061.52 requests per second
LRANGE (first 100 elements): 29577.05 requests per second
LRANGE (first 300 elements): 10431.88 requests per second
LRANGE (first 450 elements): 7010.66 requests per second
LRANGE (first 600 elements): 5296.61 requests per second
转载于:https://my.oschina.net/pblack/blog/102394
发布者:全栈程序员-用户IM,转载请注明出处:https://javaforall.cn/110228.html原文链接:https://javaforall.cn
【正版授权,激活自己账号】: Jetbrains全家桶Ide使用,1年售后保障,每天仅需1毛
【官方授权 正版激活】: 官方授权 正版激活 支持Jetbrains家族下所有IDE 使用个人JB账号...
