大家好,又见面了,我是你们的朋友全栈君。
前言:
MySQL 数据库最常见的两个瓶颈是CPU和I/O的瓶颈。CPU在饱和的时候一般发生在数据装入内存或从磁盘上读取数据时候,磁盘I/O瓶颈发生在装入数据远大于内存容量的时候。
MySQL数据库性能遇到瓶颈,如何快速定位问题的原因,是每个DBA或系统运维人员应该思考的问题。正确的借助一些性能分析工具,能够帮助DBA或系统运维人员进行问题快速的定位。
一、 Pt-qurey-digest
pt-query-digest主要用来分析mysql的慢日志,与mysqldumpshow工具相比,pt-querydigest 工具的分析结果更具体,更完善。pt-querydigest是PT工具集的子集。
1.1 安装:
yum install percona-toolkit-3.0.13-1.el7.x86_64.rpm
1.2 使用:
1、直接分析慢查询文件:
pt-query-digest /var/lib/mysql/slowtest-slow.log > slow_report.log
2、分析最近12小时内的查询:
pt-query-digest --since=12h /var/lib/mysql/slowtest-slow.log > slow_report2.log
3、分析指定时间范围内的查询:
pt-query-digest /var/lib/mysql/slowtest-slow.log --since '2017-01-07 09:30:00' --until '2017-01-07 10:00:00'> > slow_report3.log
4、分析指含有select语句的慢查询
pt-query-digest --filter '$event->{fingerprint} =~ m/^select/i' /var/lib/mysql/slowtest-slow.log> slow_report4.log
5、针对某个用户的慢查询
pt-query-digest --filter '($event->{user} || "") =~ m/^root/i' /var/lib/mysql/slowtest-slow.log> slow_report5.log
6、查询所有所有的全表扫描或full join的慢查询
pt-query-digest --filter '(($event->{Full_scan} || "") eq "yes") ||(($event->{Full_join} || "") eq "yes")' /var/lib/mysql/slowtest-slow.log> slow_report6.log
二、Innotop
innotop是一个MySQL和InnoDB事务/状态监视器,它显示查询、InnoDB事务、锁等待、死锁、外键错误,打开表,复制状态,缓冲区信息,行操作、日志、I/O操作、加载图等等。你可以使用innotop同时监控多个服务器。innotp可以综合了解你的 MySQL。
2.1、安装innotop
yum install innotop-1.11.4-1.el7.noarch
2.2、使用方法
1、基本使用
innotop --host 192.168.1.181 --user admin --password 123456 --port 3306 --delay 1 -m Q
2、参数说明,如下图:


注意::?可以切换至其他命令。
三、%20Orzdba
是taobao开源出来一个数据库实时性能查看工具,借助此工具你可以时刻了解的你的数据库的性能情况。
3.1 %20使用方法:
./orzdba_remote%20–host=192.168.1.181%20–user=“admin”%20–password=123456%20–port=3306%20-mysql%20-sys%202>/dev/null%20
参数说明:
–host:指定主机
–user:指定用户名
–password:数据库密码
–port:数据库的端口号
四、 Tcp抓包
4.1 安装tcp包
yum install tcpdump-4.9.2-3.el7.x86_64 -y
4.2 使用
1、通过tcpdump抓包
tcpdump -i any port 3306 -l -s 0 -w - |strings |grep -A 5 select|less
2、tcpdump+pt-query-digest
tcpdump -s 65535 -x -nn -q -tttt -i any -c 1000 port 3306 > mysql.tcp.txt
pt-query-digest --type tcpdump mysql.tcp.txt> slow_report9.log
五、ioprofile
5.1 pt-ioprofile
pt-ioprofile定位负载来源文件,通过ps找出负载较高的进程。
5.2 使用
pt-ioprofile --profile-pid=12036 --cell=sizes
参数说明:
–profile-pid:mysql进程的id
–cell-sizes:该参数将结果已 B/s 的方式展示出来
六、Tcprstat
通过响应时间判断数据库运行状况
6.1 安装tcprstat
如果是在64位操作系统中使用,可以直接下载二进制文件使用。步骤如下:
1)下载文件 http://github.com/downloads/Lowercases/tcprstat/tcprstat-static.v0.3.1.x86_64
2)把下载的文件移动到 /usr/bin
3)把文件名修改为 tcprstat
4)修改文件权限,增加执行权限 chmod +x /usr/bin/tcprstat 如果你想在32位操作系统中使用,那你只能自己编译了。
代码下载地址 https://github.com/Lowercases/tcprstat https://launchpad.net/tcprstat
6.2 使用
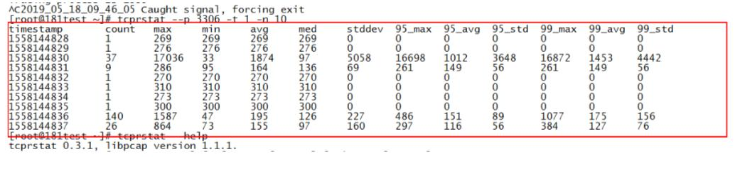
[root@localhost ~]# tcprstat –p 3306 -t 1 -n 10
timestamp count max min avg med stddev 95_max 95_avg 95_std 99_max 99_avg 99_std
1539760803 1 103 103 103 103 0 0 0 0 0 0 0
1539760804 1 108 108 108 108 0 0 0 0 0 0 0
1539760805 1 124 124 124 124 0 0 0 0 0 0 0
1539760806 1 115 115 115 115 0 0 0 0 0 0 0
1539760807 1 112 112 112 112 0 0 0 0 0 0 0
每个请求的时间在0.1ms~0.124ms
参数说明:
–p:数据库端口号
-t:刷新间隔时间
-n:输出次数
七、 Nicstat
nicstat网络利器,充分了解你的网卡运行状况)
7.1、安装nicstat
yum install http://rpmfind.net/linux/fedora/linux/releases/28/Everything/x8664/os/Packages/n/nicstat-1.95-7.fc27.x8664.rpm
7.2、使用方法
[root@lkjtest ~]# nicstat -z 1
 Time Int rKB/s wKB/s rPk/s wPk/s rAvs wAvs %Util Sat
15:29:14 ens160 4.03 0.91 43.18 1.60 95.61 581.8 0.00 0.00
15:29:15 ens160 3.09 0.73 35.95 2.00 88.11 375.5 0.00 0.00
15:29:16 ens160 3.93 0.66 43.99 2.00 91.52 335.5 0.00 0.00
15:29:17 ens160 3.99 0.66 45.00 2.00 90.71 335.5 0.00 0.00
15:29:18 ens160 4.04 0.66 46.99 2.00 88.04 335.5 0.00 0.00
15:29:19 ens160 3.64 0.66 42.00 2.00 88.76 335.5 0.00 0.00
参数说明:
-z:跳过0行
输出参数说明:
wKB/s,OutKB #每秒写的千字节数(transmitted)
rMbps,RdMbps #每秒读的百万字节数K(received)
%Util #接口的利用率百分比
Sat #每秒的错误数,接口接近饱和的一个指标
八、 Dstat
8.1 安装dstat
yum install dstat -y
8.2 使用
[root@localhost ~]# dstat -tclmndy 1
参数说明:

-t:enable time/date output
-c:enable cpu stats
-l:enable load stats
-m:enable memory stats
-n:enable network stats
-d:enable disk stats
-y:enable system stats

九、 vmtouch
vmtouch是一个学习和控制unix和类unix系统的文件系统缓存的工具。
9.1、快速安装
$ git clone https://github.com/hoytech/vmtouch.git
$ cd vmtouch
$ make
$ sudo make install
9.2、使用方法
显示
$ vmtouch -v big-dataset.txt
回收
vmtouch -ve a.txt
十、 oprofile
Oprofile 是一个开源的profiling工具,通过取样来工作,是一个全局的抽样统计工具。cpu无端占用高?应用程序响应慢?苦于没有分析的工具?找它就对了!通过计数采样,帮助我们从进程、函数、代码层面找出占用cpu的”罪魁祸首”。
###### 10.1 安装
yum install http://www.rpmfind.net/linux/centos/7.5.1804/os/x86_64/Packages/oprofile-0.9.9-25.el7.x86_64.rpm -y
10.2 使用方法
1、使用

#加载oprofile内核模块 opcontrol --init
#我们对内核的取样没兴趣 opcontrol --setup --no-vmlinux
#在开始收集采样数据前回顾下我们的设置 opcontrol --status
#清除上一次采样到的数据 opcontrol --reset
#运行我们的程序 opcontrol --start
#收集采样数据 opcontrol --dump
#关闭守护程序, 同时准备好采样的数据 opcontrol --shutdown
注意:如报Cannot find event CPUCLKUNHALTED,解决方法如下:

#解决步骤
$sudo opcontrol --deinit
Daemon not running
Unloading oprofile module

$sudo modprobe oprofile timer=1

$dmesg|grep oprofile|tail -n 1
oprofile: using timer interrupt.
如果你看到上面的字说明你成功了。
我们再试验下:
$sudo opcontrol --init && sudo opcontrol --reset && sudo opcontrol --start
Using 2.6+ OProfile kernel interface.
Using log file /var/lib/oprofile/samples/oprofiled.log
Daemon started.
Profiler running.
2、获取采样信息

#系统级别的 opreport --long-filenames
#模块级别的 opreport image:foo -l
#源码级别的 opannotate image:foo -s
3、使用样例

opcontrol --deinit
modprobe oprofile timer=1
$dmesg|grep oprofile|tail -n 1
(oprofile: using timer interrupt.)
opcontrol --reset
pcontrol --separate=lib --no-vmlinux
--start --image=/home/mysql_user/mysqlhome/bin/mysqld
opcontrol --dump
opcontrol --shutdown
opreport -l /home/mysql_user/mysqlhome/bin/mysqld
发布者:全栈程序员-用户IM,转载请注明出处:https://javaforall.cn/105852.html原文链接:https://javaforall.cn
【正版授权,激活自己账号】: Jetbrains全家桶Ide使用,1年售后保障,每天仅需1毛
【官方授权 正版激活】: 官方授权 正版激活 支持Jetbrains家族下所有IDE 使用个人JB账号...
